Continuing my series on my new VCF 9 Home Lab build (My VMware Cloud Foundation 9 Home Lab), in this post I’ll go over the basic setup for SFTP backups that need to be configured for the SDDC, NSXT, and vCenter, using my QNAP NAS.
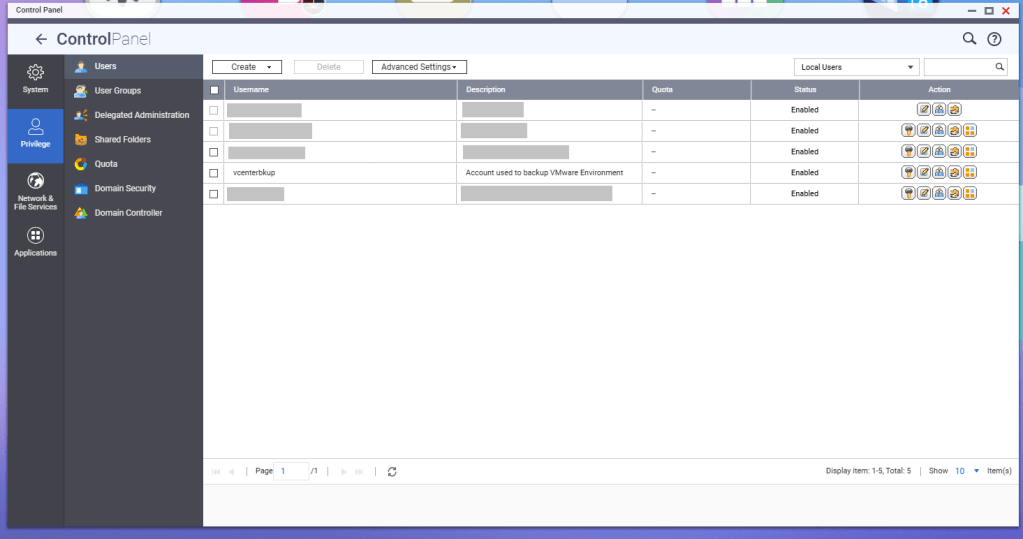
First, a service account should be created for these backup jobs. In this example, I have a service account called ‘vcenterbkup’ already created for my old VMware lab, and just plan to reuse it. You can either make this user part of the administrators group to allow SSH/SFTP connections, or you can tinker and edit the SSH configuration files (e.g., /etc/config/ssh/sshd_config) by adding AllowUsers directives.
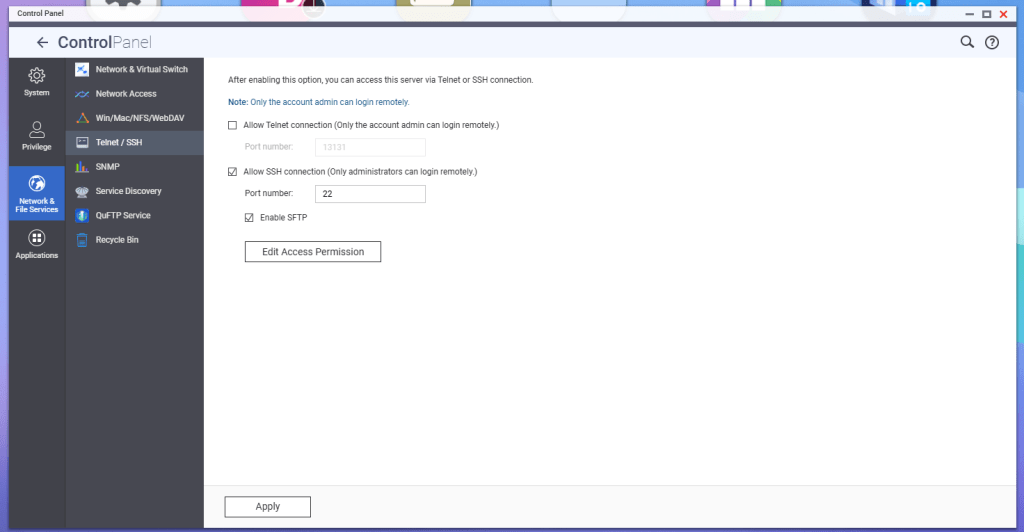
According to QNAP, in order to enable SFTP connections to the NAS, the SSH service must be enabled first, and then the SFTP enablement will be available. Go to Telnet/SSH in the Control Panel, and enable these services.
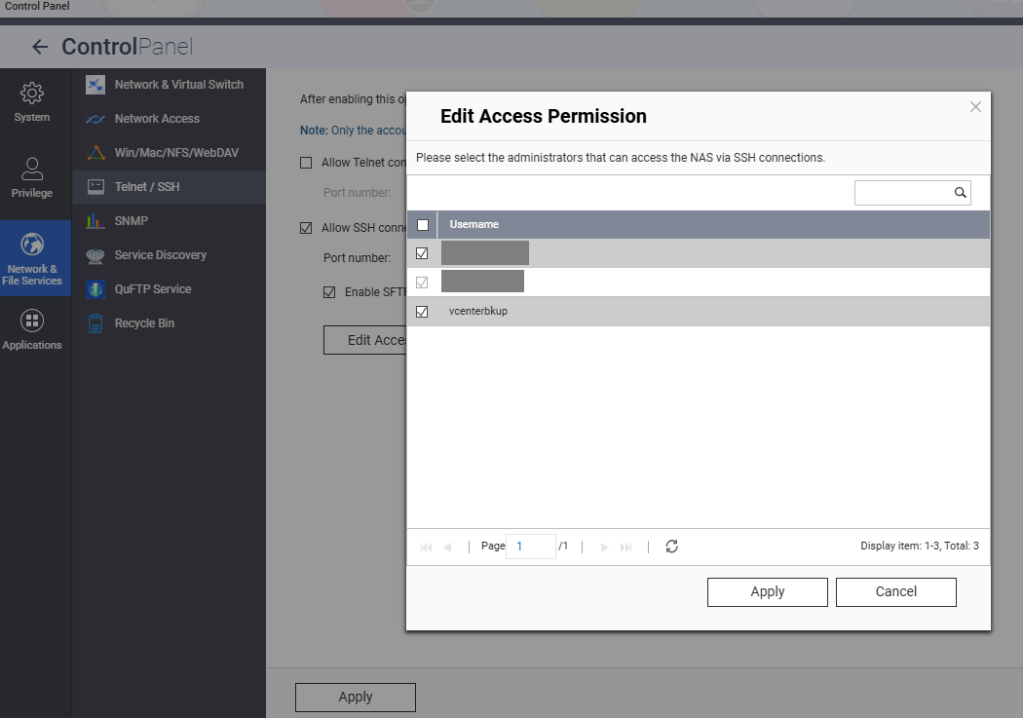
Hit the Edit Access Permission button, and add the service account created earlier, in this example ‘vcenterbkup’.
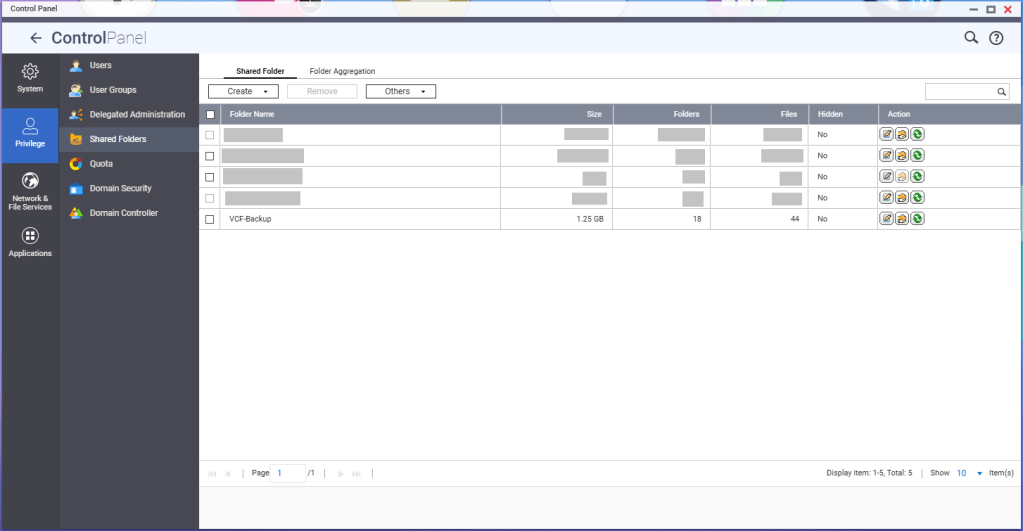
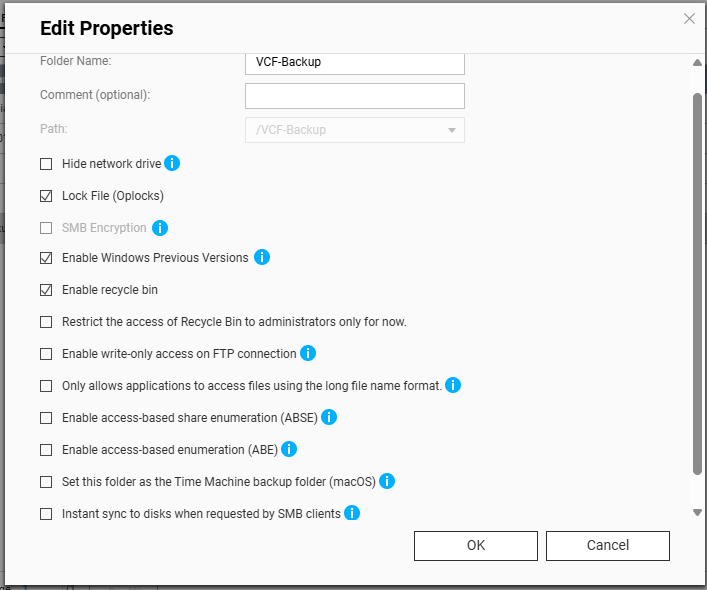
You’ll need to create a shared folder on the NAS, and assign the service account created earlier, in this example ‘vcenterbkup’, with read/write privileges. In this example, I used the folder name of ‘VCF-Backup’.
The size of the folder will depend on your backup strategy for your home lab. One important note, even though the folder path shows as “/VCF-Backup” in the UI, the actual directory will be ‘/share/VCF-Backup/ ‘. This will be important later when backups in the SDDC manager and vCenter are configured.
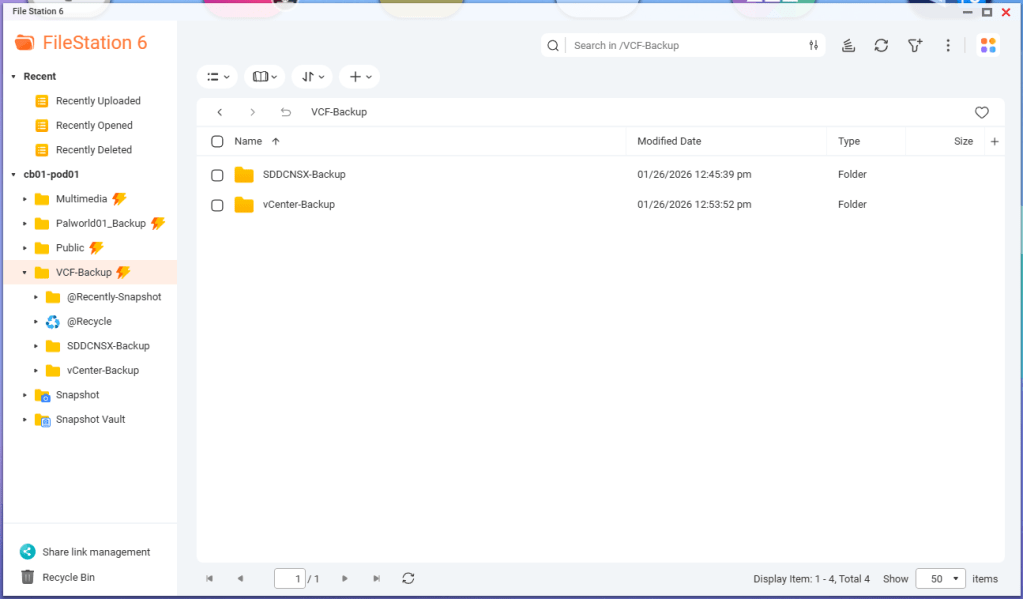
Lastly, I created sub directories inside the VCF-Backup folder. One called ‘SDDCNSX-Backup’, and the other called ‘vCenter-Backup’.
In my next blog, I’ll cover configuring the backups in the SDDC manager, NSXT, and vCenter. NSXT gets configured when the backups are configured in the SDDC manager, however it will need to be tweaked.
In this blog, I’ll go over the basic deployment of the VMware Cloud Foundation Installer appliance (formally VCF Cloud Builder) OVA, because there’s a new ‘feature’ that will trip you up if you’re not careful.
We’ve all installed OVAs before, but for the Cloud Foundation Installer OVA, there was something that I wanted to call out.
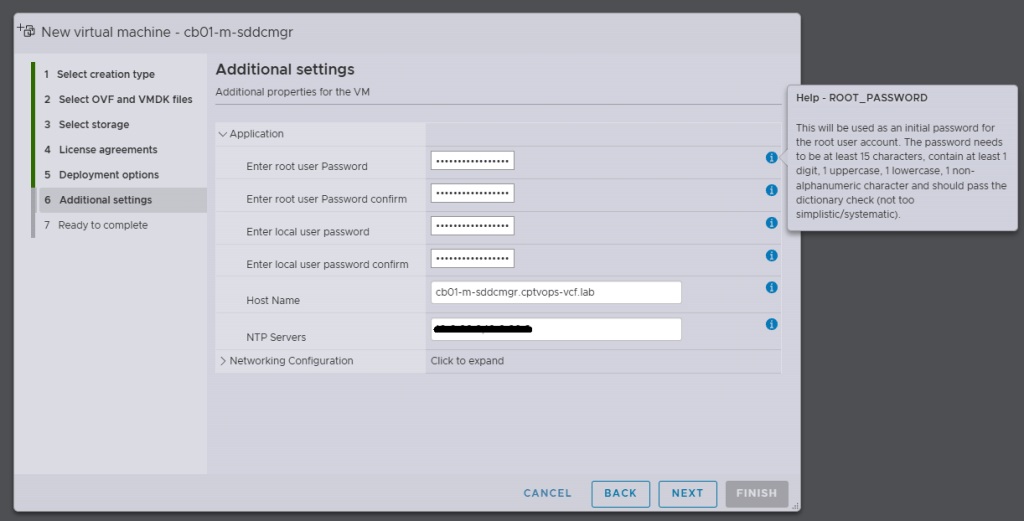
Specifically, when you’re deploying the OVA, be mindful of the new password requirements as they have changed. Previous versions of VCF through VCF 5.x, did not require a 15 character password. Apparently the quality control folks over in the VCF Division at Broadcom also forgot about this, because you can enter an 8 character passwords here, and the OVA deployment will continue as normal.
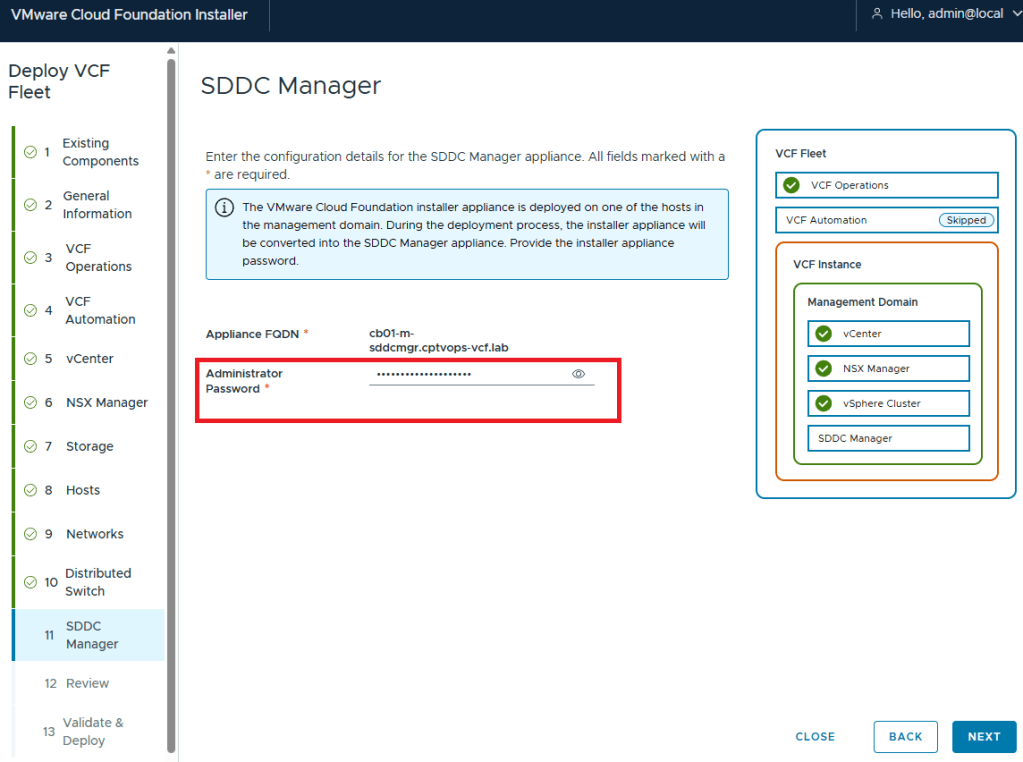
Why does this matter, well if we fast forward here a little bit, and get to where we are in the VMware Cloud Foundation deployment wizard on Step 11, you are again asked for the Administrator Password (local user). If you did not use at least a 15 character password during the OVA deployment, the wizard when you click [NEXT] will state that the Administrator password is incorrect . It doesn’t warn you that it is too short. So after a couple of tries, you will get kicked out of the wizard and back to the Cloud Foundation Installer login page, unable to log in because the local user (admin account) is now locked… I first observed this behavior during a customer deployment of 9.0, and found that the ‘feature’ is still there in the 9.0.1 I deployed for my home lab.
One of the things that I had been waiting for were the VMware Cloud Foundation 9 subscription licenses for VMUG Advantage members and the vExpert community of bloggers and SMEs. VMUG Advantage Home Lab License Guide During the week of November 17th, it was announced that the download tokens are now available for the VMUG Advantage Members who passed their VCF 9 certifications.
This post assumes that you have already deployed the VCF Installer, and are ready to get those VCF 9 bits downloaded to your home lab like a typical production environment would.
Your VMUG Advantage account email has to be the same as the one that you use with your VMware by Broadcom certifications.
After you authenticate, there’s a good chance that your session has been redirected to the Broadcom Support Portal. Past the above URL back into your browser and hit enter…
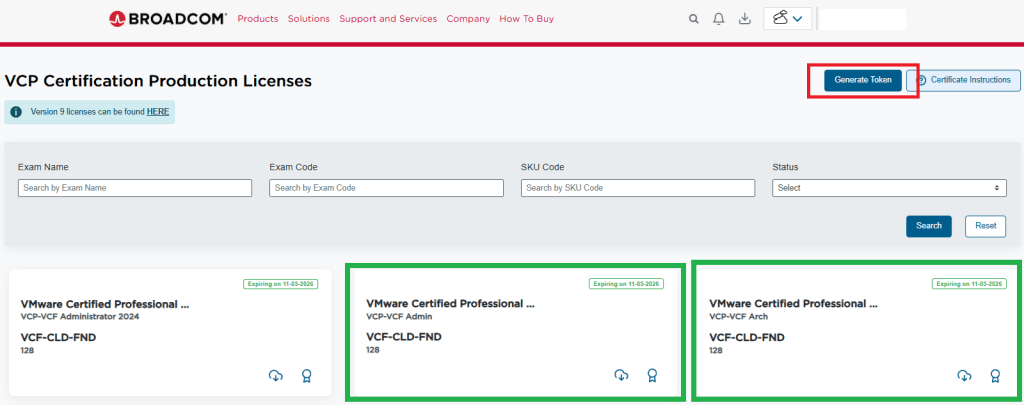
You should have now arrived at the special VMUG Advantage portal and see the VCF Certification Production Licenses in the upper left of the screen like so:
I have already requested my licences for VCF, and thus have a badge and a cloud download button on the green highlighted boxes. If you do not see those, then you would see a blue request license button. This post assumes you already have done this.
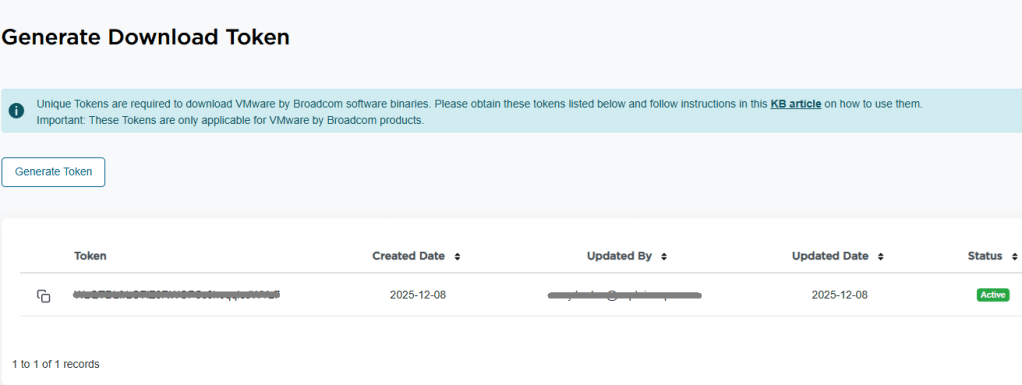
5. In the top right of the window, you see a blue “Generate Token” button. Click it. 6. On the next screen, you should see the download token needed for the VCF Installer. Copy it.
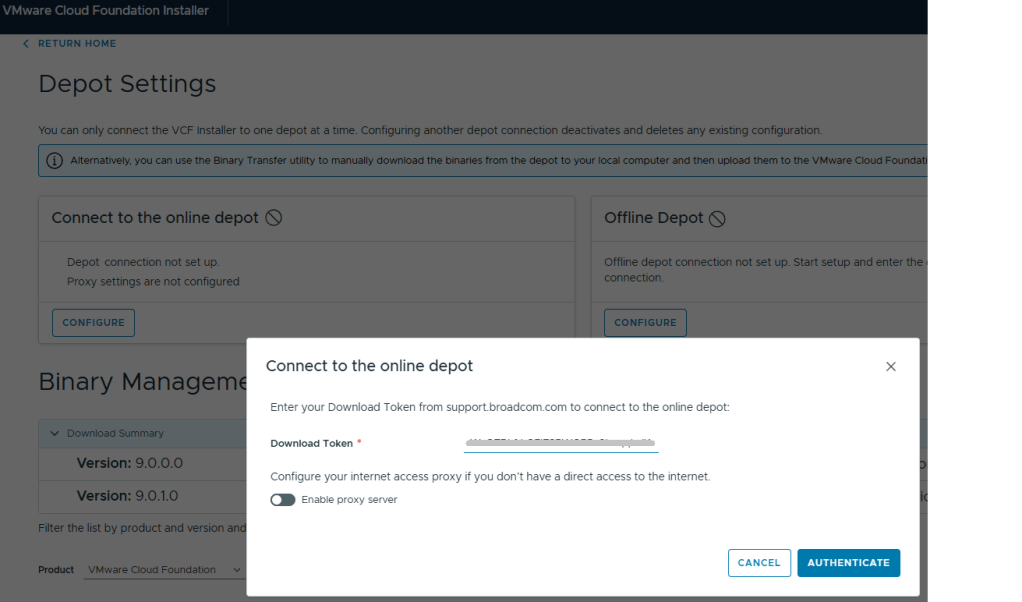
7. Log into the VCF installer appliance. 8. Go into Depot Settings, and click ‘Configure’ on the Connect to the online depot. 9. Paste the download token and click the blue ‘Authenticate’ button.
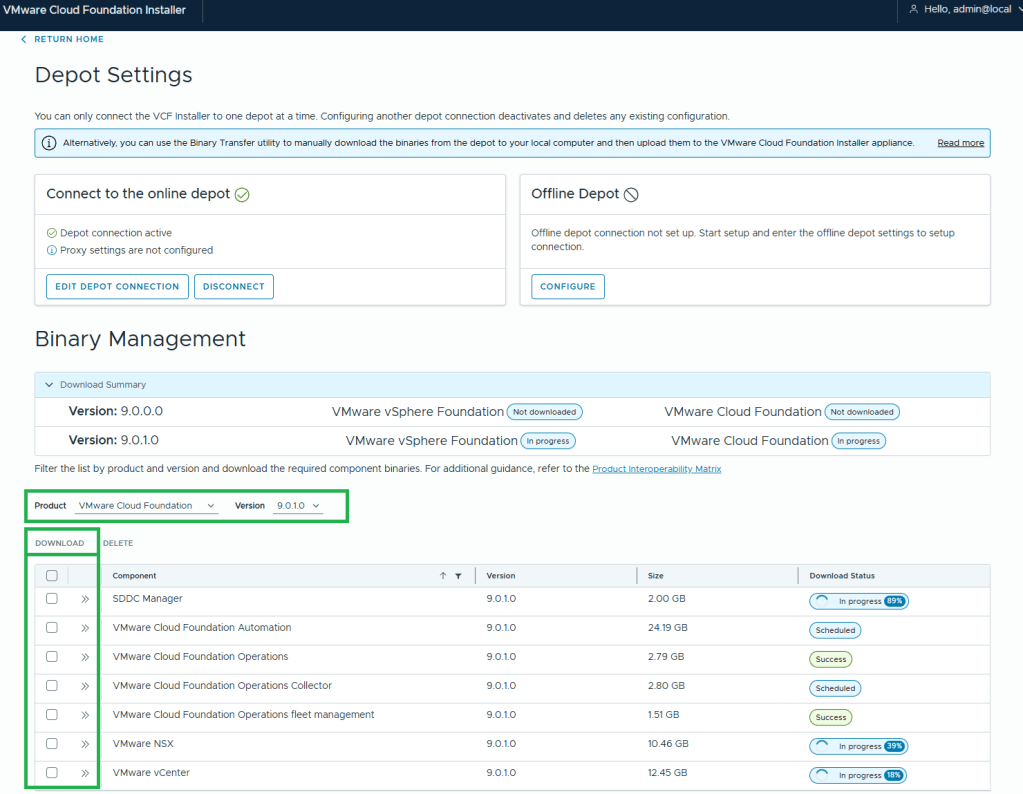
10. Assuming your VCF Installer can reach the internet and depot, a connection will be established. 11. In this example, I want to download the Product “VMware Cloud Foundation” and Version “9.0.1.0”. 12. Select all the bits desired for download, and then click the ‘DOWNLOAD’ link.
VMware by Broadcom has made this process more difficult. All of the required bits for installation used to be included with the Cloud Builder appliance that was available for VCF 5 and older versions. Now there’s an extra step to download the bits, but I’m sure that was a feature of the required download token. More complexity.
In this blog, I am going to share a problem I came across on a Professional Services engagement with a customer’s VMware Cloud Foundation 4.x environment, and our inability to remediate the root account of the NSX-T appliances.
Passwords had expired in the environment and showed disconnected in the SDDC manager UI. For the root, admin, and audit accounts, we were able to follow the following knowledge base article and get these accounts active on the NSX-T appliances: Credential operations fail on NSX Components in SDDC Manager. We tested these accounts and everything was working as expected on the appliances.
In the SDDC manager UI, we then were able to remediate and rotate the admin account for NSX-T appliances. However, while trying to remediate the root account with the known password that was already in the SDDC database, the operation failed. So we tried to create a brand new password for the root account on the NSX-T appliances, and then tried the to remediate the account again in the SDDC UI, but received the same error. “Failed to test: SSH credentials throughout the NSX-T cluster.”
Using the Reference Token from the failed task, I established an SSH connection to the SDDC appliance to review the operationsmanager log.
less /var/log/vmware/vcf/operationsmanager/operationsmanager.log
I then searched for the reference token “/OJB1CJ”, and found that the same error message given in the SDDC UI was given in the operationsmanager log. I was also finding javax.net.ssl.SSLHandshakeException error messages. I backed out of the log, and then validated that I could indeed SSH from the SDDC appliance to each of the NSX-T appliances, and that I could SSH from each of the NSX-T appliances back to the SDDC appliance, and validated that I could establish an SSH connection between each of the NSX-T appliances. Logging into the NSX-T UI, everything appeared to be happy and healthy. Lastly, I decided to check the self-signed certificates on each of the NSX-T appliances. NSX01 and NSX02 both looked proper, and had the correct FQDN for each, however, NSX03 appliance did not. Somehow it had the FQDN of the vip.
Suspecting it was the certificate on NSX03 that was hosing us, we used the VMware documentation to Replace Certificates of the NSX-T appliances with a signed certificate. We could NOT use the SDDC manager to replace the NSX-T certificates, because SDDC manager requires a good root account in order to use this automated function, and we could not fix the root account without having a proper certificates on the NSX-T appliances. We used one signed certificate across the three appliances and vip, and made sure the vip, NSX01, NSX02, and NSX03 were all in the SAN. We then validated that each NSX-T appliance had a healthy signed certificate with the padlock in the URL.
I went back to the SDDC manager UI, and was then able to successfully remediate the NSX-T root account for the workload domain. As previously mentioned above, we used Credential operations fail on NSX Components in SDDC Manager to set the accounts on the NSX-T cluster to match what the SDDC manager had, which is why we chose the password remediation option on the SDDC manager here. Now that we have validated that we have good NSX-T accounts in the SDDC manager, we now rotate the NSX-T cluster credentials so that new passwords will be generated.
In VMware Cloud Foundation 4.5.1, managing certificates of the Aria Suite LCM, NSX, VXRAIL, and vCenter Certificates should be done via the SDDC manager, so that it trusts the components certificate. The official documentation on how to do it can be found here -> Manage Certificates in a VMware Cloud Foundation.
In some cases however, certificates can be replaced/updated outside of the SDDC manager either due to a lack of understanding, or in emergency situations where certificates expired. In either of those situations, the certificate must be imported into the trusted root store on the SDDC manager appliance to re-establish trust to those components. Otherwise, SDDC manager will not function as intended.
One of my customers was interested in tracking datastore over-provisioning in Aria Operations, since they started deploying all of their virtual machines with thin-provisioned disks. After doing some digging, I found there is a Overcommit ratio metric for datastores, so in this blog I will review the creation of a custom view that we will then use in a report.
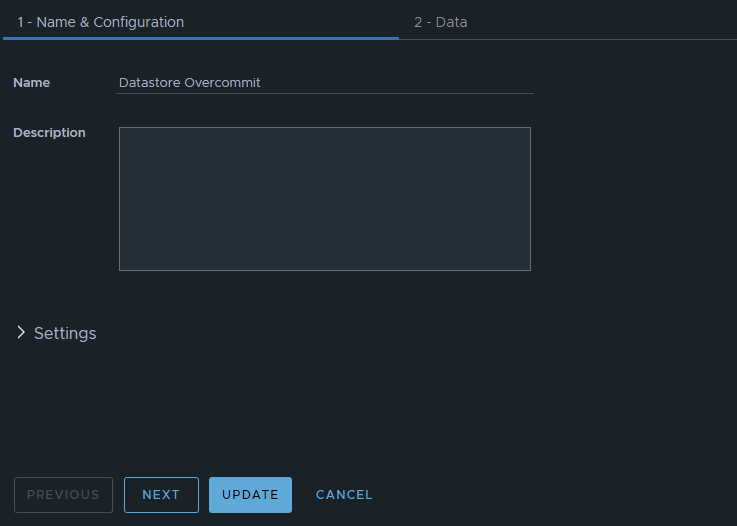
In Aria Operations under Visualize -> Views, create a new view. In this example, we’ll just call it Datastore Overcommit. Click NEXT
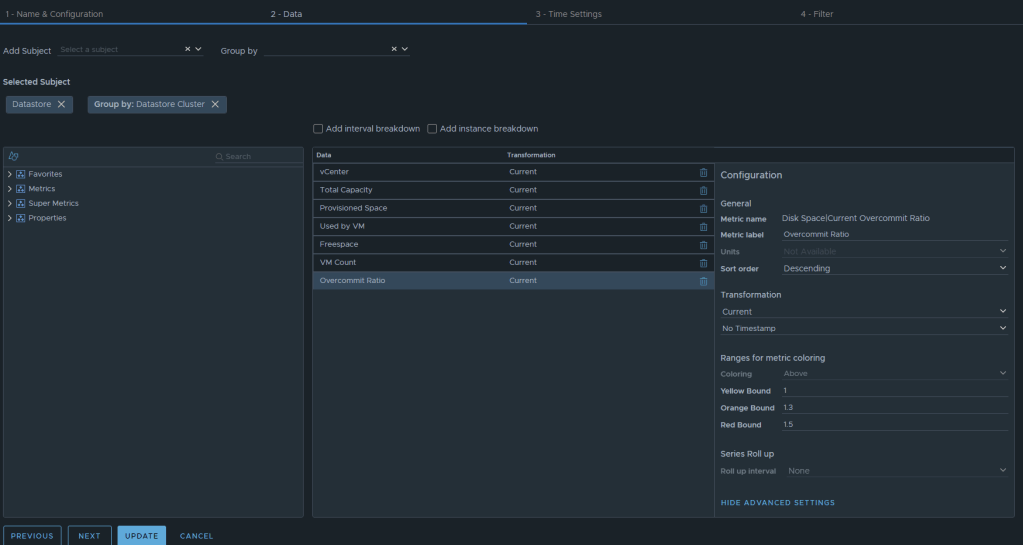
Now we can select the metrics desired. We will want to add the subject of “vCenter | datastore”, and then you could also group by “vCenter|Datastore Cluster” if you desire. For this example, I have selected the following datastore metrics: Metric: “Summary|Parent vCenter”. Label: “vCenter” Metric: “Disk Space|Total Capacity (GB)”. Label: “Total Capacity”. Unit: “GB” Metric: “Disk Space|Total Provisioned Disk Space With Overhead (GB)”. Label: “Provisioned Space”. Unit: “GB” Metric: “Disk Space|Virtual Machine used (GB)”. Label: “Used by VM”. Unit: “GB” Metric: “Disk Space|Freespace (GB)”. Label: “Freespace”. Unit: “GB” Metric: “Summary|Total Number of VMs”. Label: “VM Count”. Unit: “GB” Metric: “Disk Space|Current Overcommit Ratio”. Label: “Overcommit Ratio”. Sort Order: “Descending” Coloring Above: Yellow Bound: “1”. Orange Bound: “1.3”. Red Bound: “1.5”
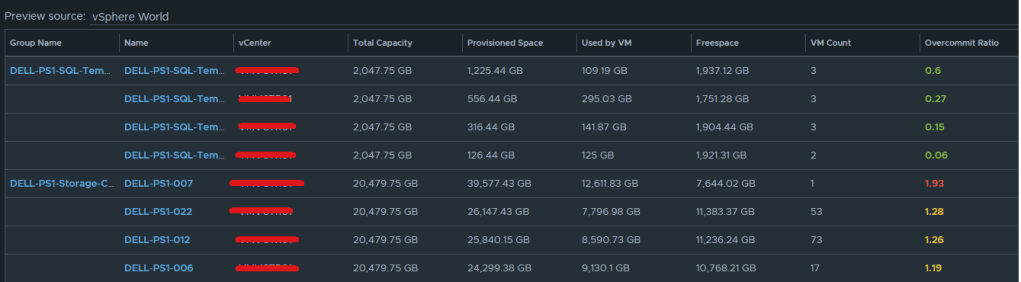
The end result should look something like this:
I typically will set the Preview Source as “vSphere World” to see the output data I am getting.
If you don’t like the datastores being grouped by the datastore cluster, then just undo the grouping option, and all of the datastores that are the worst overcommit offenders will rise to the top. The view can now be saved.
Creating an Aria Operations Report.
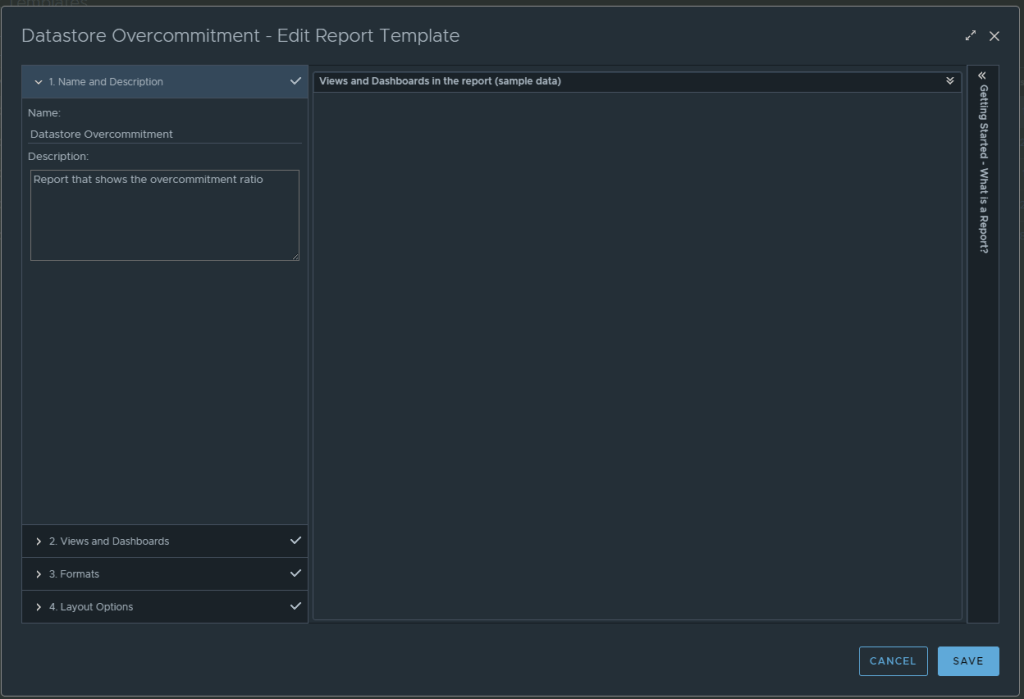
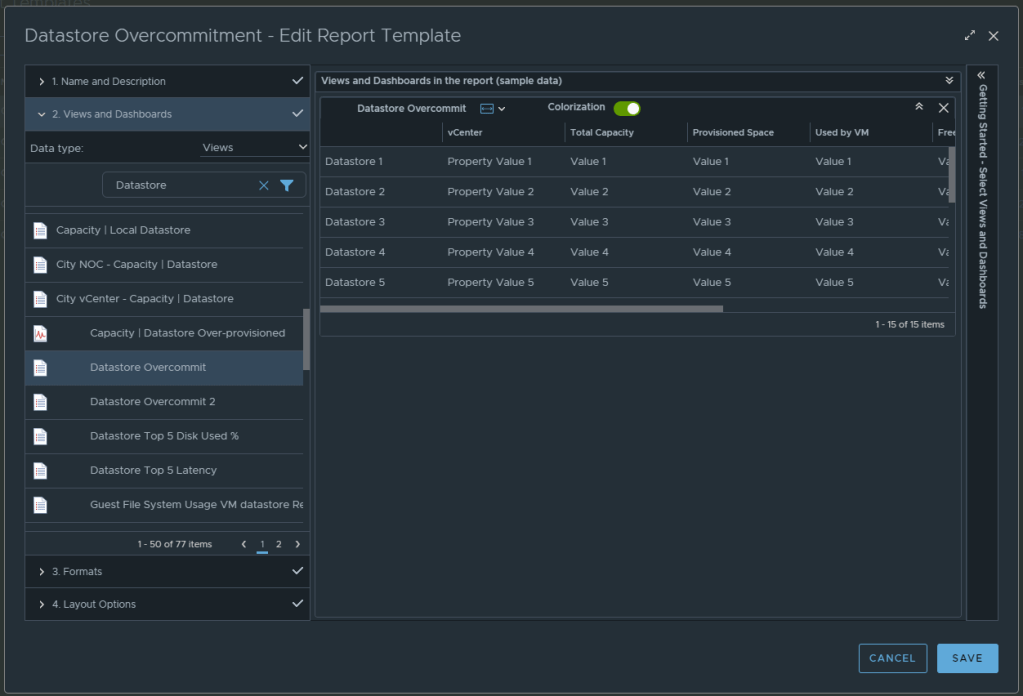
In Aria Operations, Under Visualize -> Reports, create a new report. In this example we call it Datastore Overcommitment.
In section 2 for views and dashboards, I searched for datastore and found the newly created “Datastore Overcommit” view created earlier. I dragged it to the right. I changed the Orientation to landscape, and turned on Colorization.
From here, under section 3 you can select the format of the report PDF and/or CSV, and then under section 4 you can elect to add a cover page and what not. I personally like getting a PDF and CSV. Now can click SAVE to save the report.
From here, you can run the report or schedule it. It’s that simple.
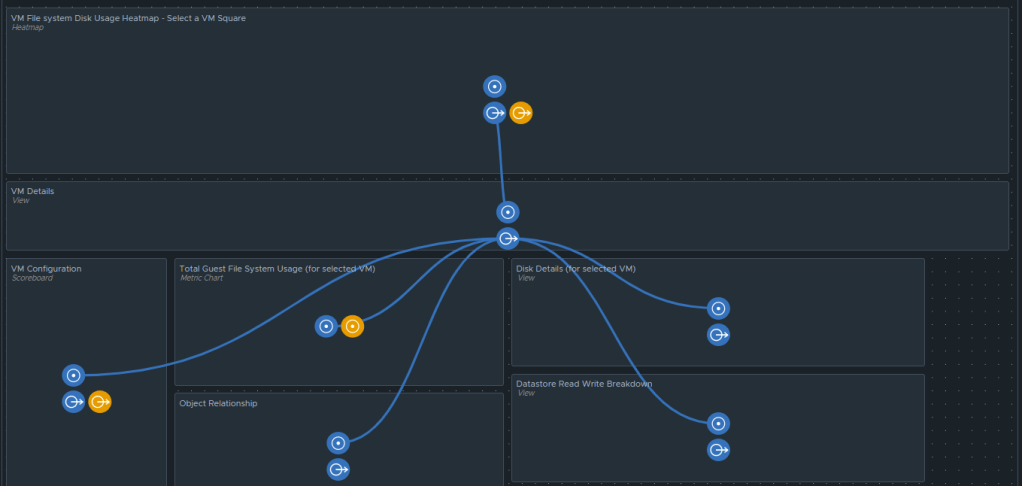
For the past couple of months, I have been working with a customer developing Aria Operations (formally vROps) dashboards for various interests. The dashboard I’ll cover here was one I created to help them track and identify the guest file system usage of the virtual machine. This works for both Microsoft and Linux based systems.
Box 1a is a heatmap widget configured as a self provider configured to refresh every 300 seconds. Additional configuration as follows:
The heatmap is a nice visual that will turn red as the guest file system consumes disks on the VM to spot problems. You then select a box in the heatmap to populate the 2a. Box 2a then feeds data into 2b, 2c, 2d, and 2e.
Box 2a is a custom list view widget i created that lists several metrics of the virtual machine with custom metric labels. It is configured to auto select the first row.
Those metrics are: “Badge|Health%“, “Configuration|Hardware|Disk Space“, “Guest File System|Utilization (%)“, (Coloring above: Yellow 75, Orange 80, Red 90); “Virtual Disk:Aggregate of all instances|Read IOPS“, (Coloring above: Yellow 100, Orange 200, Red 300); “Virtual Disk:Aggregate of all instances|Write IOPS“, (Coloring above: Yellow 100, Orange 200, Red 300); “Virtual Disk:Aggregate of all instances|Read Latency (ms)“, (Coloring above: Yellow 10, Orange 20, Red 30); “Virtual Disk:Aggregate of all instances|Write Latency (ms)“, (Coloring above: Yellow 10, Orange 20, Red 30); “Datastore:Aggregate of all instances|Total Latency (ms)“, “Datastore:Aggregate of all instances|Total Throughput“, “Disk Space|Snapshot|Age (Days)“, (Coloring above: Yellow 7, Orange 14, Red 21); “Disk Space|Snapshot Space“.
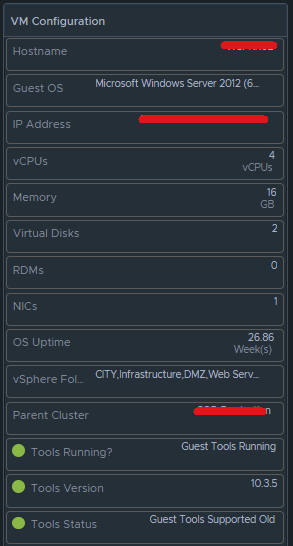
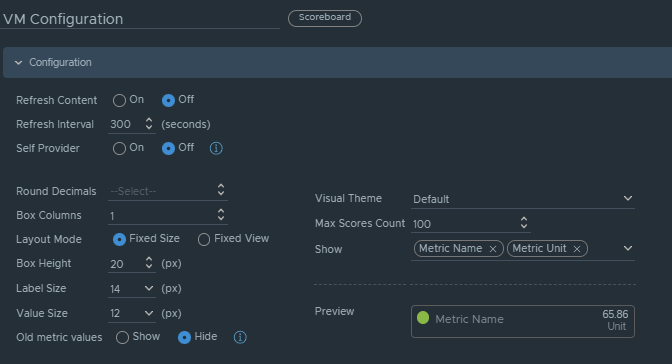
Box 2b is a Scoreboard widget configured to list the selected VM details regarding information on how the VM is configured.
Configuration is set like so:
Under Input Transformation, set to self.
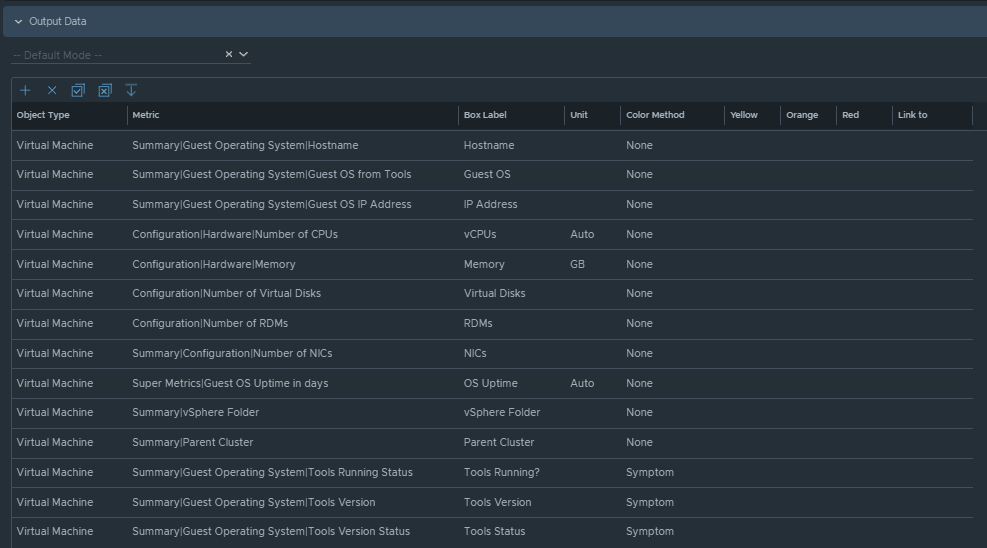
Output Data will be configured as follows:
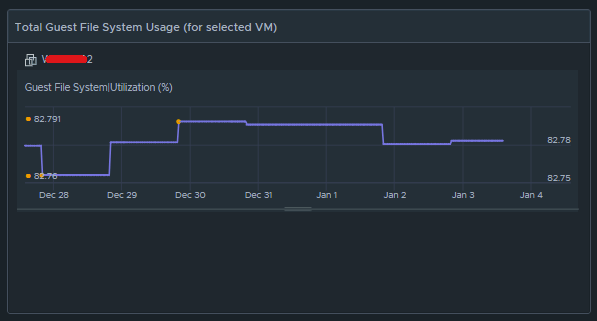
Box 2c is a metric chart widget with the Input Transformation configured as self, and the Output data configured to use the virtual machine metric “Guest File System|Utilization”.
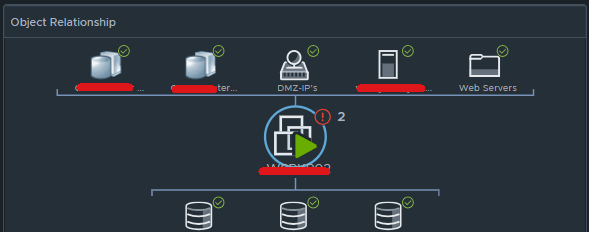
Box 2d is simply the Object Relationship widget.
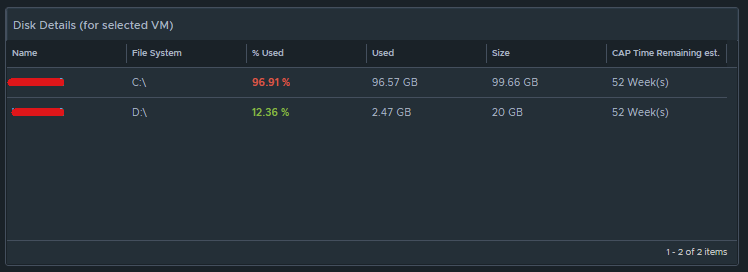
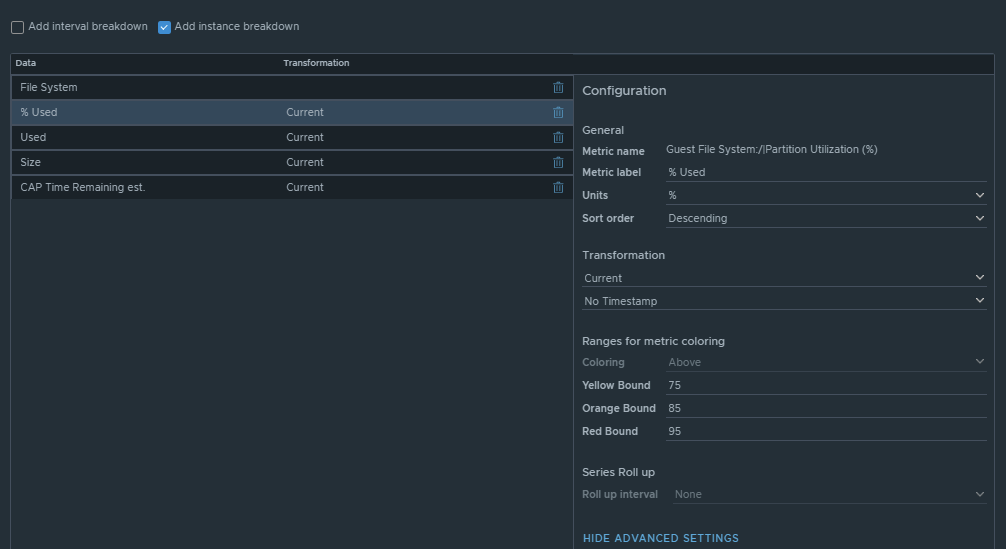
Box 2e is another custom list view and is configured to refresh every 300 seconds.
This list view is configured to do an instance breakdown of the following metrics:
Box 3a is fed data from 2e so that we can see how the virtual machine disks are behaving on the datastore(s).
This is another custom list view configured as follows:
Configuration is set to refresh content at 300 seconds. Output data is configured with a custom list view with the following metrics: “Devices:Aggregate of all instances|Read Latency (ms)“, (Coloring above: Yellow 10, Orange 20, Red 30); “Devices:Aggregate of all instances|Write Latency (ms)“, (Coloring above: Yellow 10, Orange 20, Red 30); “Devices:Aggregate of all instances|Read IOPS“, (Coloring above: Yellow 100, Orange 200, Red 300); “Devices:Aggregate of all instances|Write IOPS“, (Coloring above: Yellow 100, Orange 200, Red 300); “Devices:Aggregate of all instances|Read Throughput“; “Devices:Aggregate of all instances|Write Throughput“.
Those are all of the configured widgets on this dashboard. The integration schema will look like this:
I do hope to share this dashboard with the VMware Code sample exchange, and I will update this blog once that has been completed. I hope my breadcrumbs above will enable you to create a similar dashboard in the meantime.
Blog Date: June 25, 2021 Tested on vSphere 7.0.1 Build 17327586 vSphere with Tanzu Standard
On a recent customer engagement, we ran into an issue where after we deployed project Contour, and created a TLS delegation “contour-tls”, but we ran into an issue where Contour did not like the public wildcard certificate we provided. We were getting an error message “TLS Secret “projectcontour/contour-tls” is invalid: Secret not found.”
After an intensive investigation to make sure everything in the environment was sound, we came to the conclusion that the “is invalid” part of the error message suggested that there was something wrong with the certificate. After working with the customer we discovered that they included the Root, the certificate, and the intermediate authorities in the PEM file. The root doesn’t need to be in the pem. Just the certificate, and the intermediate authorities in descending order. Apparently that root being in the pem file made Contour barf. Who knew?
You could possibly see that the certificate is the issue by checking the pem data for both the <PrivateKeyName>.key and the <CertificateName>.crt by running the following commands, and comparing the pem output. IF it doesn’t match this could be your issue as well. The “<>” should be updated with your values, and don’t include these “<” “>”.
Below are the troubleshooting steps we took, and what we did to resolve the issue. We were using Linux, and had been logged into vSphere with Tanzu already. Did I mention that I hate certificates? But I digress….
The Issue:
You had just deployed a TKG cluster, and then deployed Project Contour as the ingress controller that uses a load balancer to be the single point of entry for all external users. This connection terminates SSL connections, and you have applied a public wildcard certificate to it. You created the TLS secret, and have created the TLS delegation, so that new apps deployed to this TKG cluster can delegate TLS connection terminations to contour. However, after you deployed your test app to verify the TLS delegation is working, you see a status of “Invalid. At least one error present, see errors for details.”, after running the following command:
kubectl get httpproxies
Troubleshooting:
You run the following command to gather more information, and see in the error message: “Secret not found” Reason: “SecretNotValid“
kubectl describe httpproxies.projectcontour.io
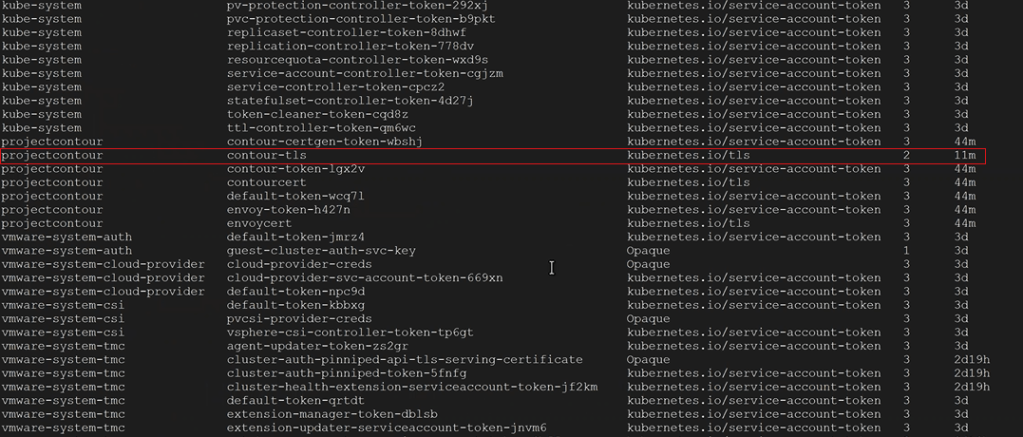
2. You check to make sure the TLS Secret was created in the right namespace with the following command, and you see that it is apart of the desired namespace. In this example, our namespace was called projectcontour, and the TLS secret was called contour-tls.
kubectl get secrets -A
3. You check the TLS delegation to make sure it was created with the following command. In this example ours was called contour-delegation, and our namespace is projectcontour.
kubectl get tlscertificatedelegations -A
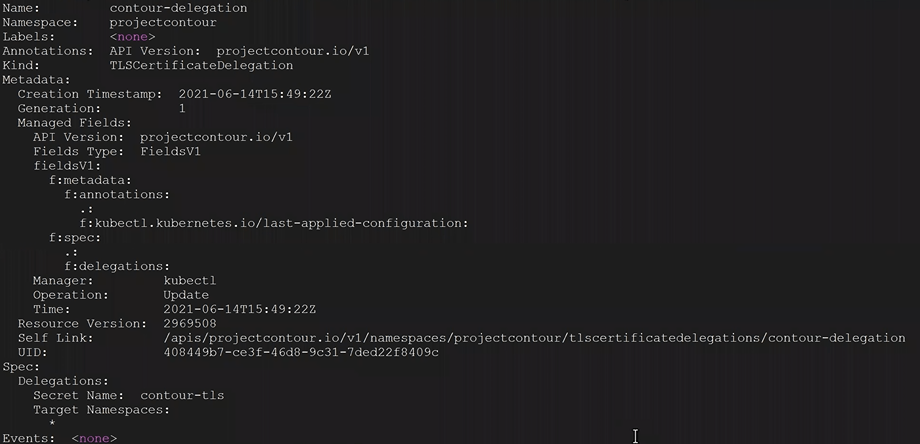
4. You look at the contents of the tlscertificatedelegations with the following command, and nothing looks out of the ordinary.
kubectl describe tlscertificatedelegations -A
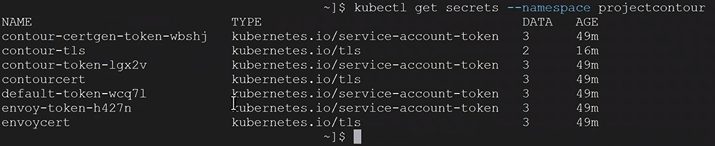
5. You check to see the secrets of the namespace with the following command. In this example our namespace is called projectcontour and we can see our TLS delegation contour-tls.
kubectl get secrets --namespace projectcontour
6. You validate contour-tls has data in it with the following command. In this example, our namespace is projectcontour and our TLS is contour-tls.
kubectl get secrets --namespace projectcontour contour-tls -o yaml
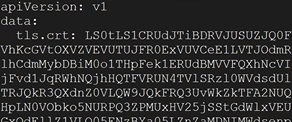
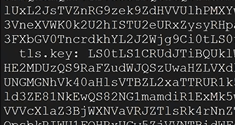
In the yaml output, up at the top you should see tls.crt: with data after
Down towards the bottom of the yaml output, you should see tls.key with data after
Conclusion: Everything looks proper on the Tanzu side. Based on the error message we saw “TLS Secret “projectcontour/contour-tls” is invalid: Secret not found.” The “is invalid” part could suggest that there is something wrong with the contents of the TLS secret. At this point, the only other possibility would be that the public certificate has something wrong and needs to be re-generated. The root doesn’t need to be in the pem. Just the certificate for the site, and intermediate authorities in descending order.
The Resolution:
Create and upload the new public certificate for contour to vSphere with Tanzu.
We’ll need to delete the secret and re-create it. Our secret was called “contour-tls”, and the namespace was called “projectcontour”.
3. We needed to clean our room, and delete the httpproxies we created in our test called test-tls.yml, and an app that was using the TLS delegation. In this example it was called tls-delegation.yml
kubectl delete -f test-tls.yml
kubectl delete -f tls-delegation.yml
4. Now we created a new secret called contour-tls with the new cert. The <> indicates you need to replace that value with your specific information. The “<>” does not belong in the command.
5. Validate the pem values for .key and .crt match. The <> indicates you need to replace that value with your specific information. The “<>” does not belong in the command.
6. If the pem numbers match, the certificate is valid. Lets go ahead an re-create the tls-delegation. Example command:
kubectl apply -f tls-delegation.yml
7. Now you should be good to go. After you deploy your app, you should be able to check the httpproxies again for Project Contour, and see that it has a valid status
kubectl get httpproxies.projectcontour.io
If all else fails, you can open a ticket with VMware GSS to troubleshoot further.
Blog Date: June 18, 2021 Tested on vSphere 7.0.1 Build 17327586 vSphere with Tanzu Standard
On a recent customer engagement, we ran into an issue where vSphere with Tanzu wasn’t successfully deploying. We had intermittent connectivity to the internal Tanzu landing page IP. What we were fighting ended up being inconsistent MTU values configured both on the VMware infrastructure side, and also in the customers network. One of the many prerequisites to a successful installation of vSphere with Tanzu, is having a consistent MTU value of 1600.
The Issue:
Tanzu was just deployed to an NSX-T backed cluster, however you are unable to connect to the vSphere with Tanzu landing page address to download Kubernetes CLI Package via wget. Troubleshooting in NSX-T interface shows that the load balancer is up that has the control plane VMs connected to it.
Symptoms:
You can ping the site address IP of the vSphere with Tanzu landing page
You can also telnet to it over 443
Intermittent connectivity to the vSphere with Tanzu landing page
Intermittent TLS handshake errors
vmkping tests between host vteps is successful.
vmkping tests from hosts with large 1600+ packet to nsx edge node TEPs is unsuccessful.
These validations should have been completed prior to the deployment. However, in this case we were finding inconsistent MTU settings. So to simplify, these are what you need to look for.
In NSX-T, validate that the MTU on the tier-0 gateway is set to a minimum of 1600.
In NSX-T, validate that the MTU on the edge transport node profile is set to a minimum of 1600.
In NSX-T, validate that the MTU on the host uplink profile is set to a minimum of 1600.
In vSphere, validate that the MTU on the vSphere Distributed Switch (vDS) is set to a minimum of 1600.
In vSphere, validate that the MTU on the ESXi management interface (vmk0) is set to a minimum of 1600.
In vSphere, validate that the MTU on the vxlan interfaces on the hosts is set to a minimum of 1600.
Troubleshooting:
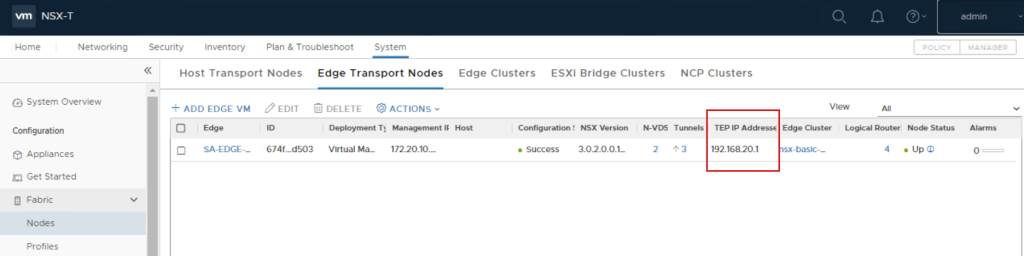
In the Tanzu enabled vSphere compute cluster, SSH into an ESXi host, and ping from the host’s vxlan interface to the edge TEP interface. This can be found in NSX-T via: System, Fabric and select Nodes, edge transport nodes, and find the edges for Tanzu. The TEP interface IPs will be to the right. In this lab, I only have the one edge. Production environments will have more.
In this example, vxlan was configured on vmk10 and vmk11 on the hosts. Your mileage may vary.
We are disabling fragmentation with (-d) so the packet will stay whole. We are using a packet size of 1600
If the ping is unsuccessful, we need to identify the size of the packet that can get through. Try a packet size of 1572. If unsuccessful try 1500. If unsuccessful try 1476. If unsuccessful try 1472, etc.
To test farther up the network stack, we can perform a ping something that has a different VLAN, subnet, and is on a routable network. In this example, the vMotion network is on a different network that is routable. It has a different VLAN, subnet, and gateway. We can use two ESXi hosts from the Tanzu enabled cluster.
Open SSH sessions to ESXi-01 and ESXi-02.
On ESXi-02, get the PortNum for the vMotion vmk. On the far left you will see the PortNum for the vMotion enabled vmk. Run the following command:
4. On the ESXi-01 session, use the vmkping command to ping the vMotion interface of ESXi-02. In this example we use a packet size of 1472 because that was the packet size the could get through, and option -d to prevent fragmentation.
# vmkping -I vmk0 -s 1472 -d <ESXi-02_vMotion_IP>
5. On the ESXi-02 session, we should now see six or more entries. Do a CTRL+C to cancel the packet capture.
6. Looking at the packet capture output on ESXi-02, We can see on the request line that ESXi-01 MAC address made a request to ESXi-02 MAC address.
On the next line for reply, we might see a new MAC address that is not ESXi-01 or ESXi-02. If that’s the case, then give this MAC address to the Network team to troubleshoot further.
Testing:
Using the ESXi hosts in the Tanzu enabled vSphere compute cluster, we can ping from the host’s vxlan interface to the edge TEP interface.
The edge TEP interface can be found in NSX-T via: System, Fabric and select Nodes, edge transport nodes, and find the edges for Tanzu. The TEP interface IPs will be to the far right.
You will need to know what host vmks the vxlan is enabled. In this example we are using vmk10 and vmk11 again.
In this example we are using vmk10 and vmk11 again. We are disabling fragmentation with (-d) so the packet will stay whole. We are using a packet size of 1600. These should now be successful.
On the ESXi-01 session, use the vmkping command to ping something on a different routable network, so that we can force traffic out of the vSphere environment and be routed. In this example just like before, we will be using the vMotion interface of ESXi-02. Packet size of 1600 should now work. We still use option -d to prevent fragmentation.
# vmkping -I vmk0 -s 1600 -d <ESXi-02_vMotion_IP>
On the developer VM, you should now be able to download the vsphere-plugin.zip from the vSphere with Tanzu landing page with the wget command.
I recently had a customer engagement with Log Insight, and not only did they want to use it as the main log collector for their infrastructure, but they also wanted it to collect logs from their Windows virtual servers. Good news! There is a content pack called “Microsoft – Windows” that should be installed. This contains a configuration template for windows servers. This is used to create a group, so that every time a windows box has the agent installed, the agent picks up the settings from the server and forwards its logs. Otherwise, we must configure each agent ini file manually which is not ideal. There is also a Linux content pack on the market place that can be setup as well. This blog will focus on the Windows content pack, but the steps for Linux is very similar.
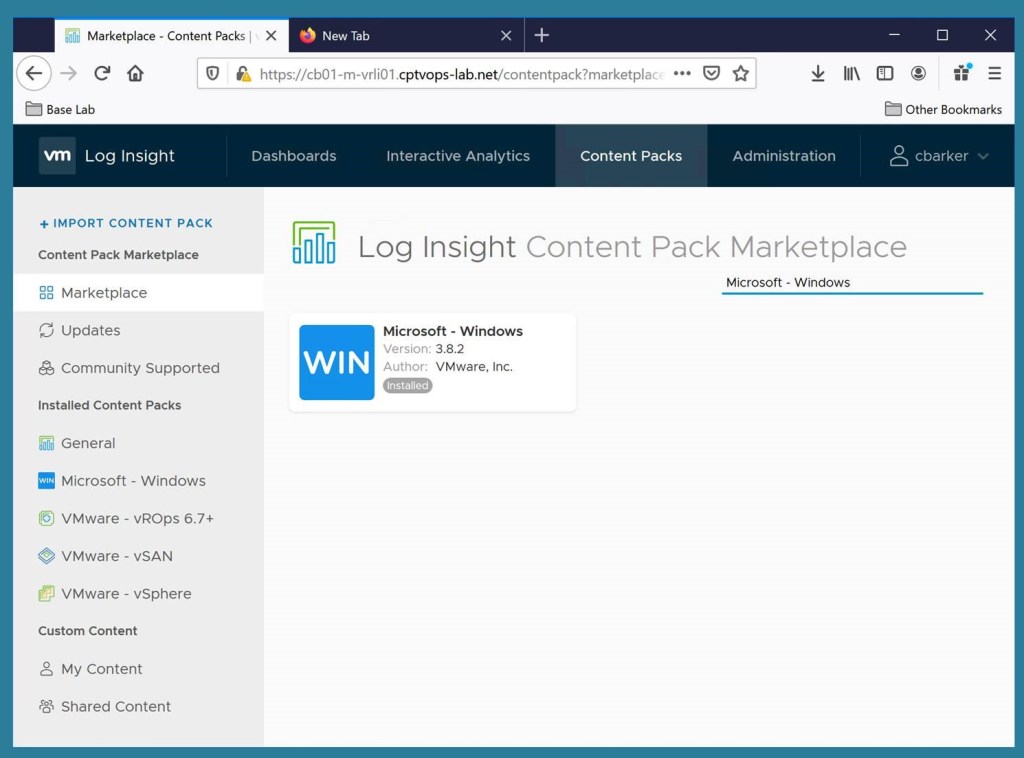
The ” Microsoft – Windows” content pack can be found in the Marketplace in Log Insight located on the Content Packs tab.
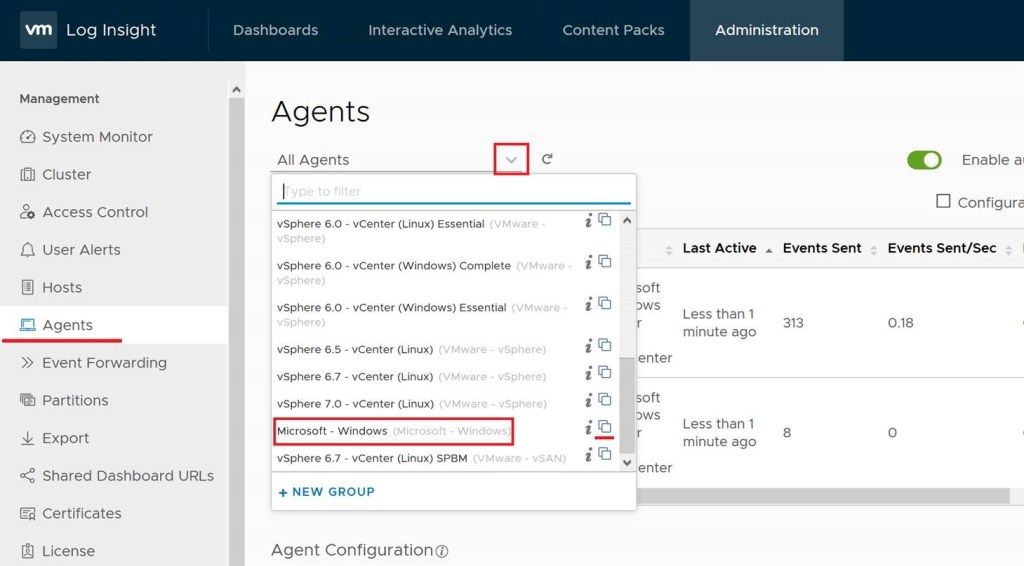
Once this is installed, go back to the Administration tab, and click on agents in the left column. Click the down carrot next to All Agents, and find “Microsoft – Windows” in the list. To the right of it, click the double box icon to copy the template.
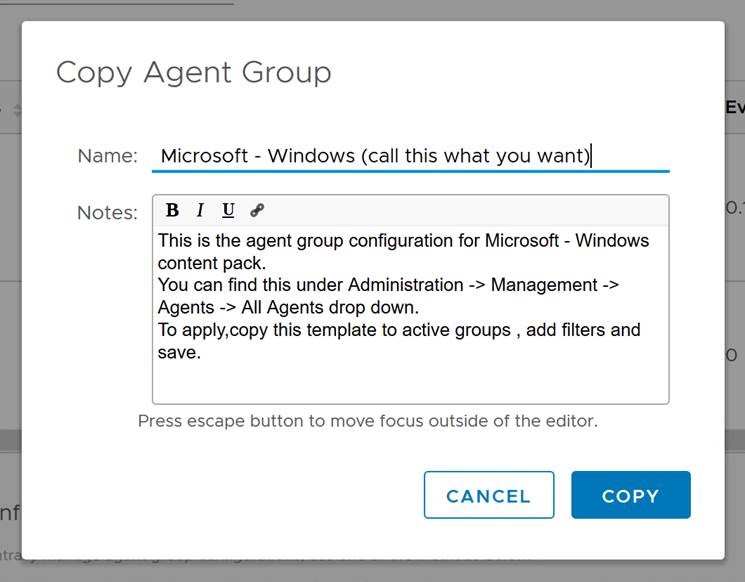
Name the group, and click copy.
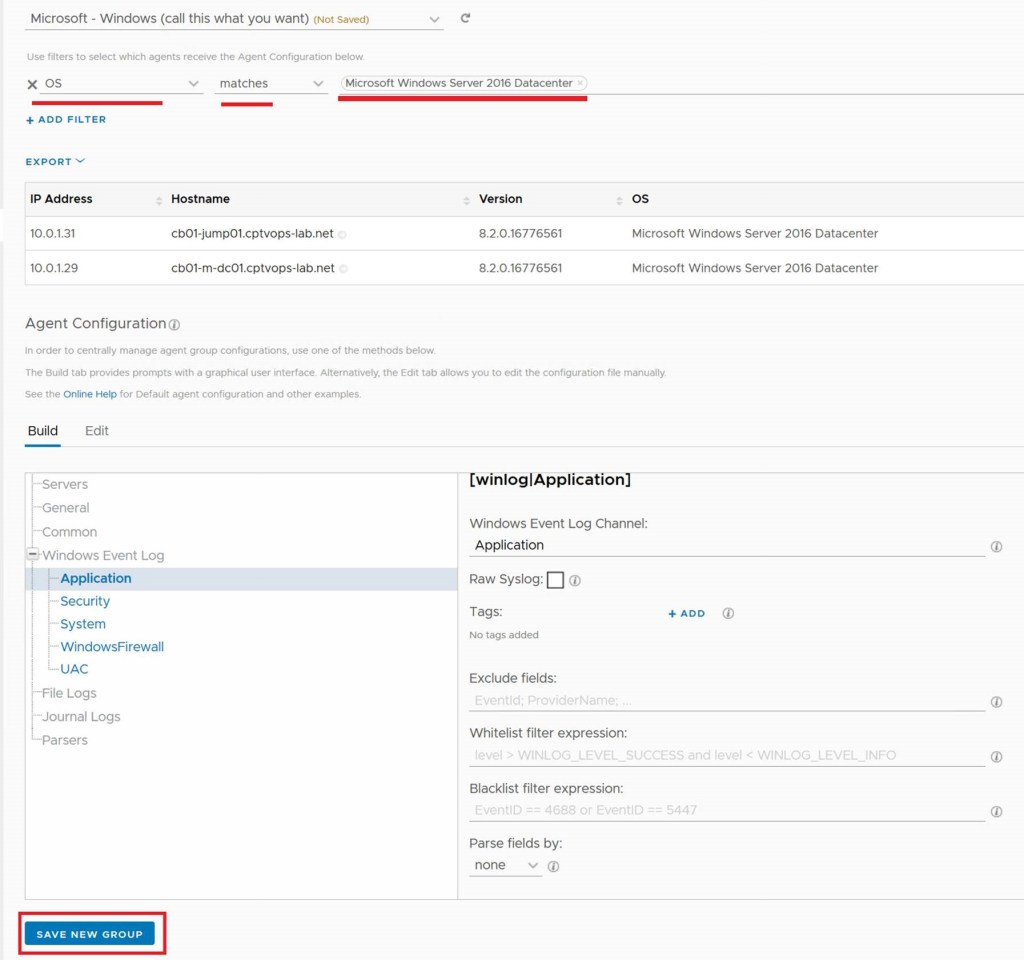
Now you configure the filter to find the windows server. In my example, I chose “OS” “Matches” “Microsoft Windows Server 2016 Datacenter”. Click Save New Group button below.
Now that we have a Windows group defined for the agents, go ahead and install the agent on the Windows Server, and now it will have a proper configuration and begin forwarding its logs. If the box already has the agent installed, you might need to restart the agent, or reinstall it.
Likewise, there is also a Linux content pack on the market place that can be setup as well. For either, we don’t have to create one group to rule them all. You can get creative with your group filters, and have specific groups for specific server functions.


You must be logged in to post a comment.