
Blog Date: June 25, 2021
Tested on vSphere 7.0.1 Build 17327586
vSphere with Tanzu Standard
On a recent customer engagement, we ran into an issue where after we deployed project Contour, and created a TLS delegation “contour-tls”, but we ran into an issue where Contour did not like the public wildcard certificate we provided. We were getting an error message “TLS Secret “projectcontour/contour-tls” is invalid: Secret not found.”
After an intensive investigation to make sure everything in the environment was sound, we came to the conclusion that the “is invalid” part of the error message suggested that there was something wrong with the certificate. After working with the customer we discovered that they included the Root, the certificate, and the intermediate authorities in the PEM file. The root doesn’t need to be in the pem. Just the certificate, and the intermediate authorities in descending order. Apparently that root being in the pem file made Contour barf. Who knew?
You could possibly see that the certificate is the issue by checking the pem data for both the <PrivateKeyName>.key and the <CertificateName>.crt by running the following commands, and comparing the pem output. IF it doesn’t match this could be your issue as well. The “<>” should be updated with your values, and don’t include these “<” “>”.
openssl pkey -in <PrivateKeyName>.key -pubout -outform pem | sha256sumopenssl x509 -in <CertificateName>.crt -pubkey -noout -outform pem | sha256sumBelow are the troubleshooting steps we took, and what we did to resolve the issue. We were using Linux, and had been logged into vSphere with Tanzu already. Did I mention that I hate certificates? But I digress….
The Issue:
You had just deployed a TKG cluster, and then deployed Project Contour as the ingress controller that uses a load balancer to be the single point of entry for all external users. This connection terminates SSL connections, and you have applied a public wildcard certificate to it. You created the TLS secret, and have created the TLS delegation, so that new apps deployed to this TKG cluster can delegate TLS connection terminations to contour. However, after you deployed your test app to verify the TLS delegation is working, you see a status of “Invalid. At least one error present, see errors for details.”, after running the following command:
kubectl get httpproxies

Troubleshooting:
- You run the following command to gather more information, and see in the error message: “Secret not found” Reason: “SecretNotValid“
kubectl describe httpproxies.projectcontour.io
2. You check to make sure the TLS Secret was created in the right namespace with the following command, and you see that it is apart of the desired namespace. In this example, our namespace was called projectcontour, and the TLS secret was called contour-tls.
kubectl get secrets -A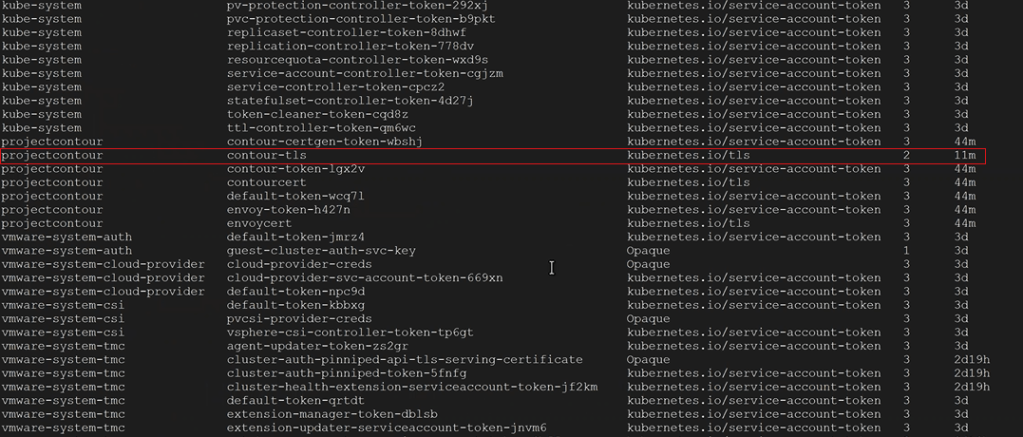
3. You check the TLS delegation to make sure it was created with the following command. In this example ours was called contour-delegation, and our namespace is projectcontour.
kubectl get tlscertificatedelegations -A
4. You look at the contents of the tlscertificatedelegations with the following command, and nothing looks out of the ordinary.
kubectl describe tlscertificatedelegations -A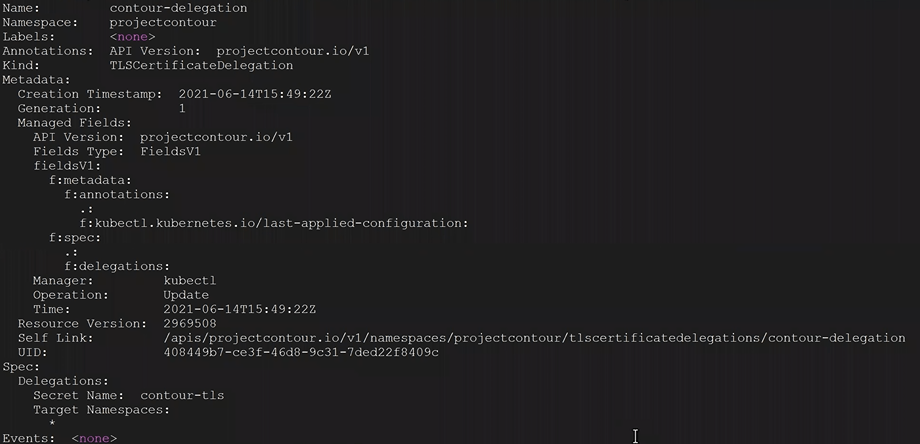
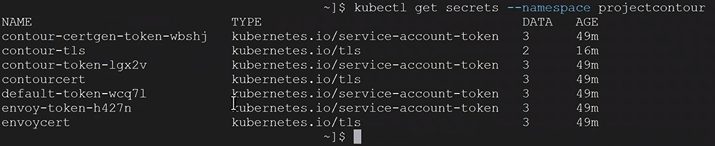
5. You check to see the secrets of the namespace with the following command. In this example our namespace is called projectcontour and we can see our TLS delegation contour-tls.
kubectl get secrets --namespace projectcontour
6. You validate contour-tls has data in it with the following command. In this example, our namespace is projectcontour and our TLS is contour-tls.
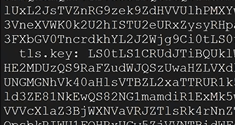
kubectl get secrets --namespace projectcontour contour-tls -o yamlIn the yaml output, up at the top you should see tls.crt: with data after
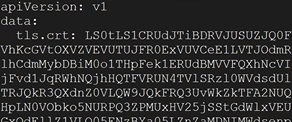
Down towards the bottom of the yaml output, you should see tls.key with data after
Conclusion: Everything looks proper on the Tanzu side. Based on the error message we saw “TLS Secret “projectcontour/contour-tls” is invalid: Secret not found.” The “is invalid” part could suggest that there is something wrong with the contents of the TLS secret. At this point, the only other possibility would be that the public certificate has something wrong and needs to be re-generated. The root doesn’t need to be in the pem. Just the certificate for the site, and intermediate authorities in descending order.
The Resolution:
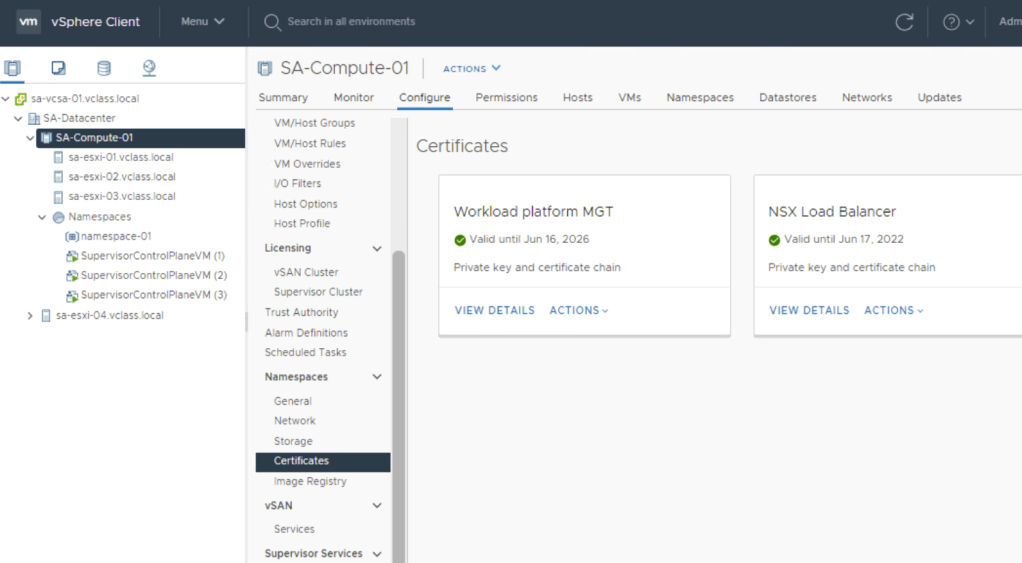
- Create and upload the new public certificate for contour to vSphere with Tanzu.
- We’ll need to delete the secret and re-create it. Our secret was called “contour-tls”, and the namespace was called “projectcontour”.
kubectl delete secrets contour-tls -n projectcontour3. We needed to clean our room, and delete the httpproxies we created in our test called test-tls.yml, and an app that was using the TLS delegation. In this example it was called tls-delegation.yml
kubectl delete -f test-tls.ymlkubectl delete -f tls-delegation.yml4. Now we created a new secret called contour-tls with the new cert. The <> indicates you need to replace that value with your specific information. The “<>” does not belong in the command.
kubectl create secret tls contour-tls -n projectcontour --cert=<wildcard.tanzu>.pem --key=<wildcard.tanzu>.key5. Validate the pem values for .key and .crt match. The <> indicates you need to replace that value with your specific information. The “<>” does not belong in the command.
openssl pkey -in <PrivateKeyName>.key -pubout -outform pem | sha256sum
openssl x509 -in <CertificateName>.crt -pubkey -noout -outform pem | sha256sum

6. If the pem numbers match, the certificate is valid. Lets go ahead an re-create the tls-delegation. Example command:
kubectl apply -f tls-delegation.yml7. Now you should be good to go. After you deploy your app, you should be able to check the httpproxies again for Project Contour, and see that it has a valid status
kubectl get httpproxies.projectcontour.io
If all else fails, you can open a ticket with VMware GSS to troubleshoot further.


You must be logged in to post a comment.