I first applied to be a VMware Expert back at the end of 2016 after attending my first VMworld in Las Vegas, and began sharing my experience with the vCommunity through this Captain vOPS blog.
I was lucky enough to join VMware Inc. as an employee in February 2021 to continue working in the Professional Services division working with SLED customers. VMware employee’s had it good back in the day, and we had a pretty robust internal lab environment that I would use for VMware Cloud Foundation Customer projects. I can say with the utmost certainty, that I wouldn’t be where I am today without having a lab to familiarize myself with the VMware product line, both for work and for learning at home. In March of 2025 a little more than a year after the Broadcom acquisition, Broadcom announced that 80% of VMware projects would be sent to Broadcom partners, and the VMware badged PS consultants who were affected by this new strategy, were given the opportunity to transition with them to partners.
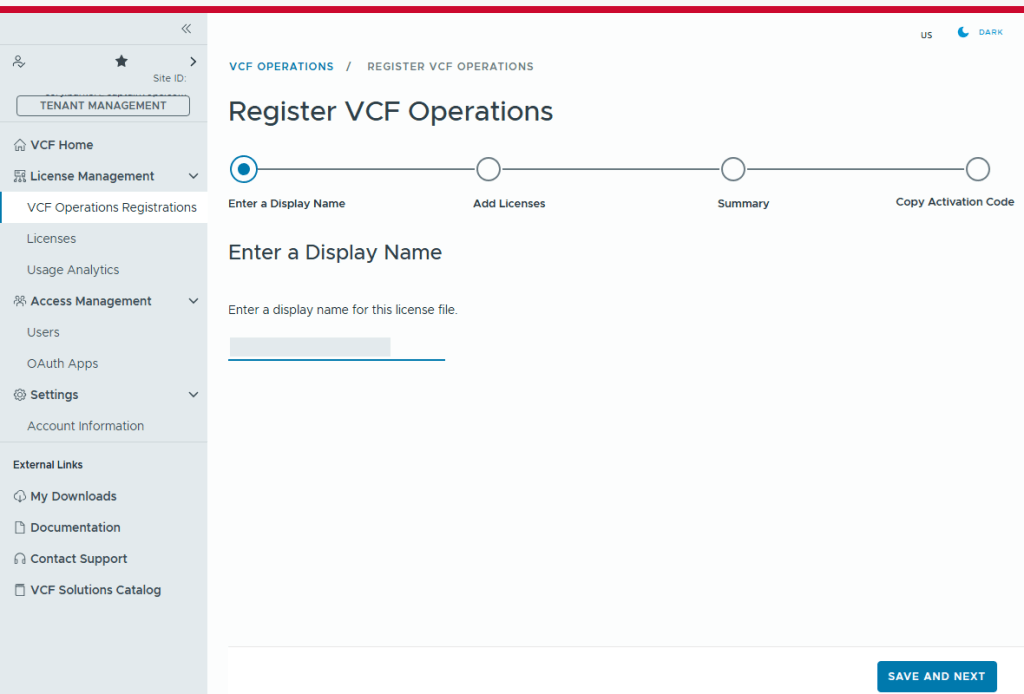
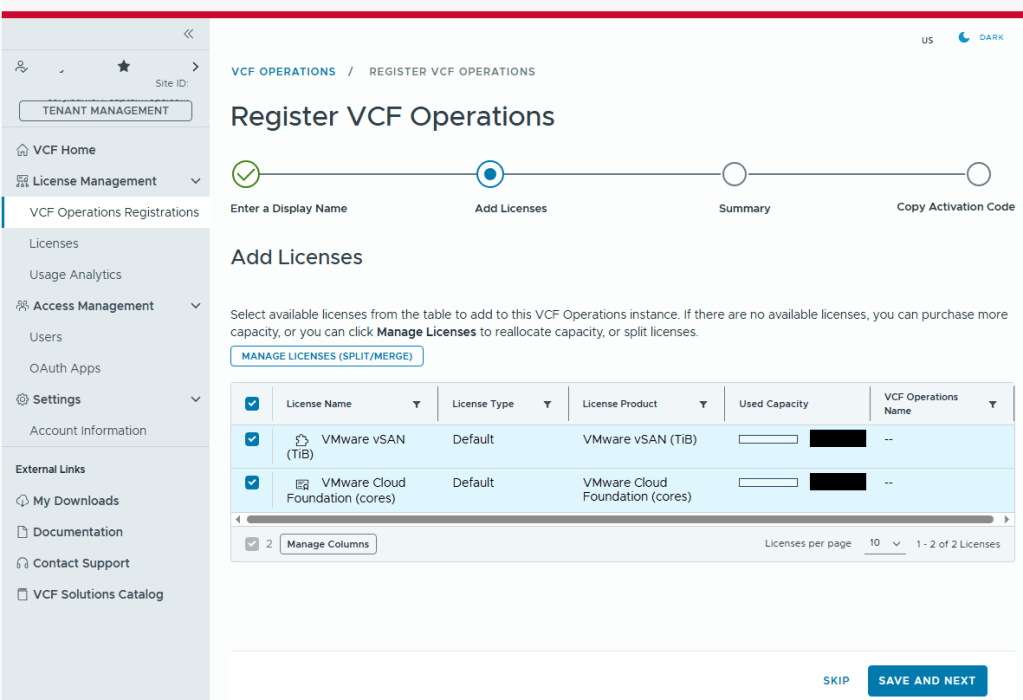
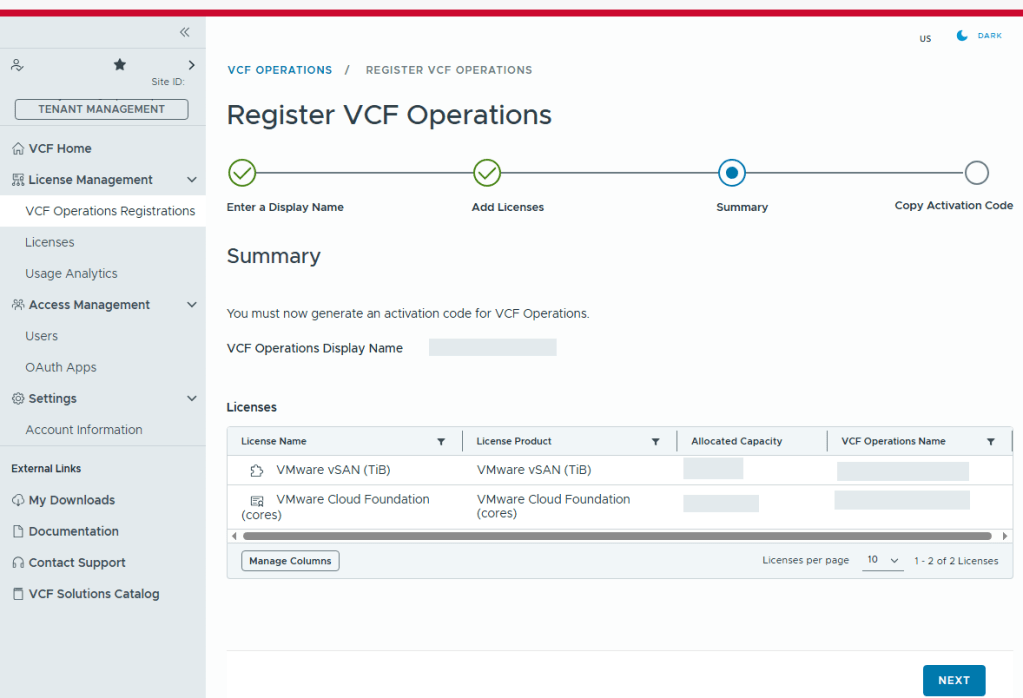
The Broadcom partner ecosystem is currently building their own lab environments for VMware consultants, but myself and many others could not afford to wait. Many of us built new home labs with the expectation that we would be able to deploy VCF 9 after Broadcom made the GA announcement late July before Explore. It took the VMUG Advantage team a few extra months to build new backend systems that would adhere to Broadcom’s new VMware subscription and usage reporting system, and many of us were excited to hear that the system finally went live in November. I blogged about how to set that up HERE.
I’ve been deploying VCF for customers through Cloud providers, partners, and VMware itself, going all the way back to the VCF 2.X days. For me, the VMUG Advantage partnership program with the vExpert program, isn’t just a mechanism to get licenses for my VMware home lab. It is a CRITICAL enabler for me to do my job.
It has been a rough year with all of these changes to the VMware brand I once fought for. To that end, I send my heart felt thanks to the VMUG Advantage team, and the vExpert program. They are terrific communities to be a part of. The vExpert program along with its partnership with VMUG Advantage license program has really enabled me to keep doing the job that I love, working with VMware customers, helping them achieve their private cloud goals, as we all try to navigate this new landscape together. A special thanks to Corey Romero and Eric Nielsen for keeping these communities alive before, during, and after the transition.
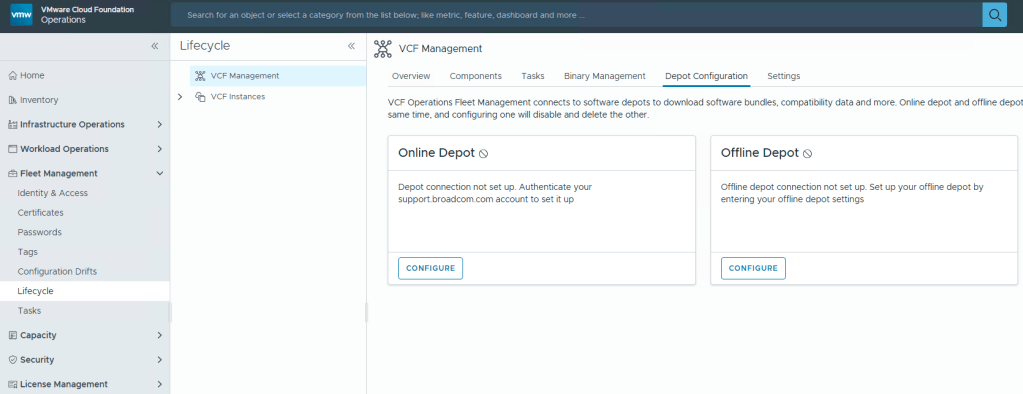
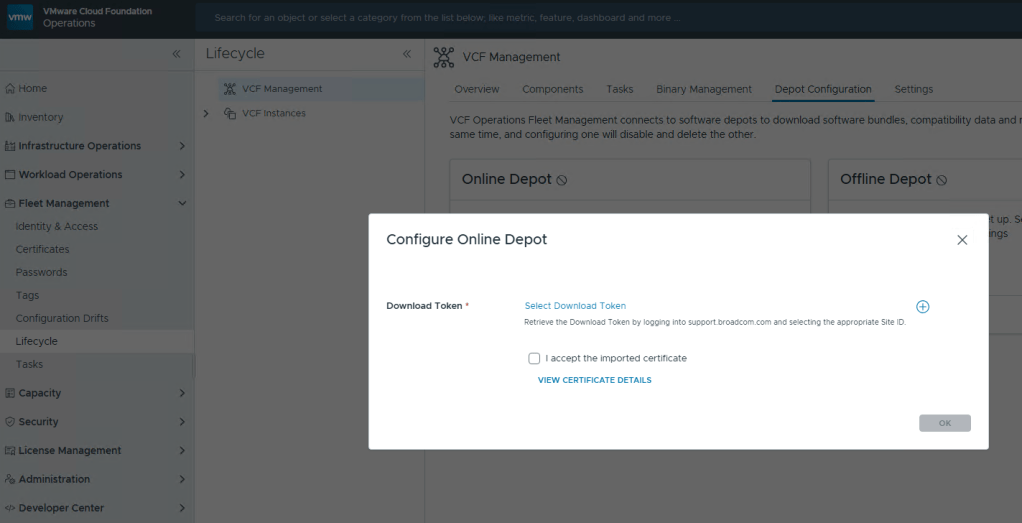
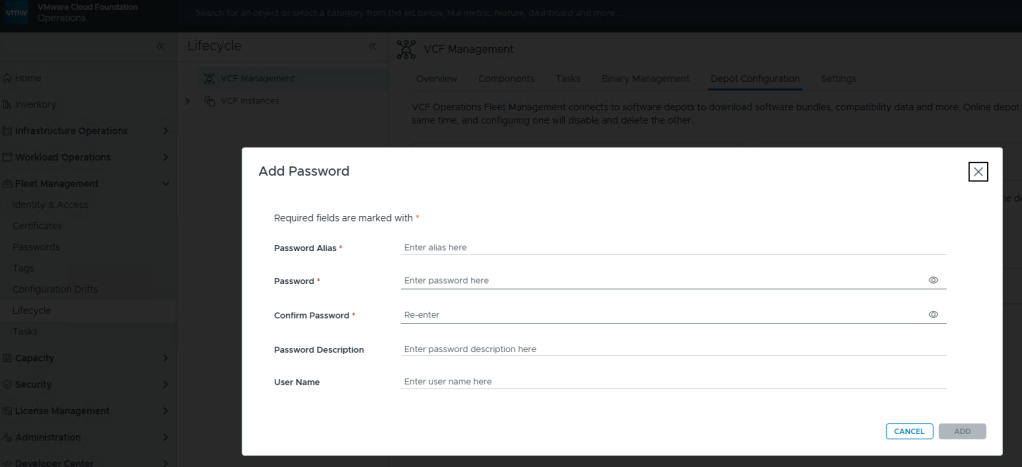
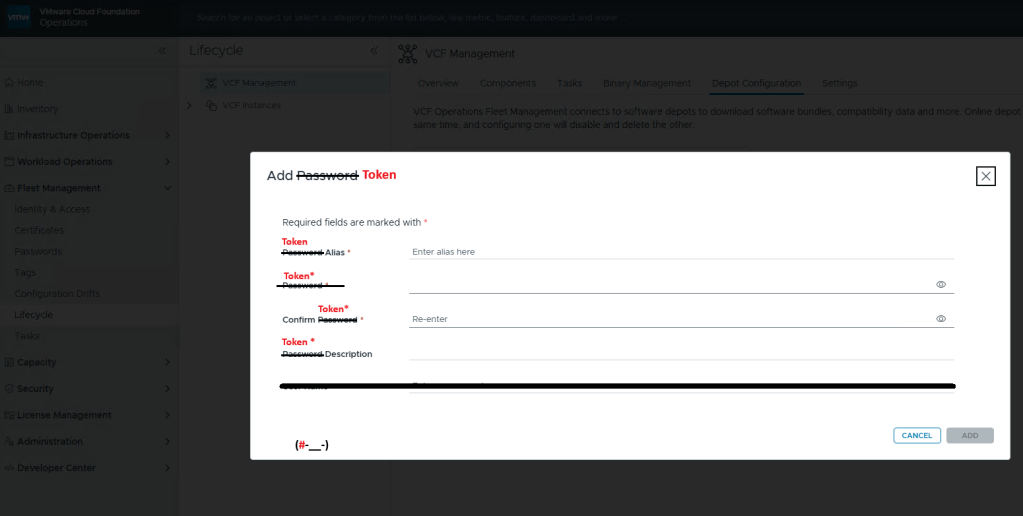
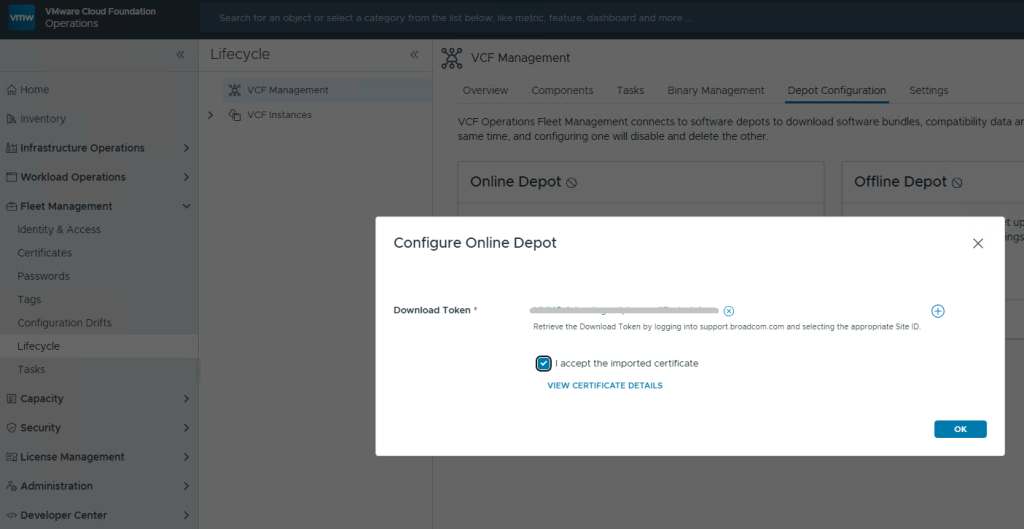
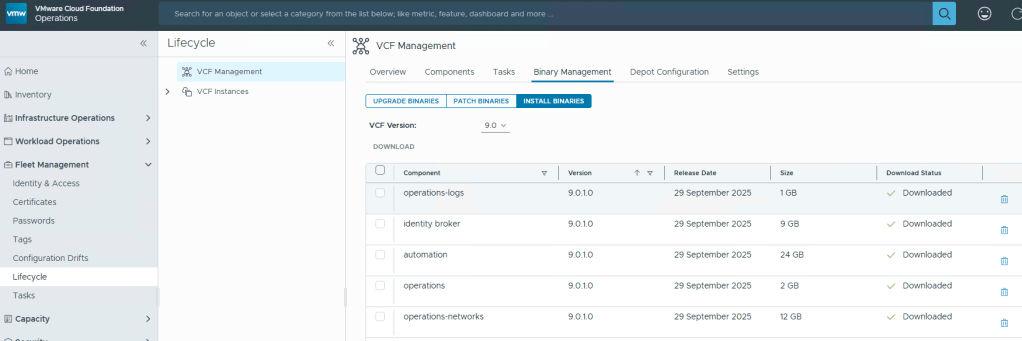
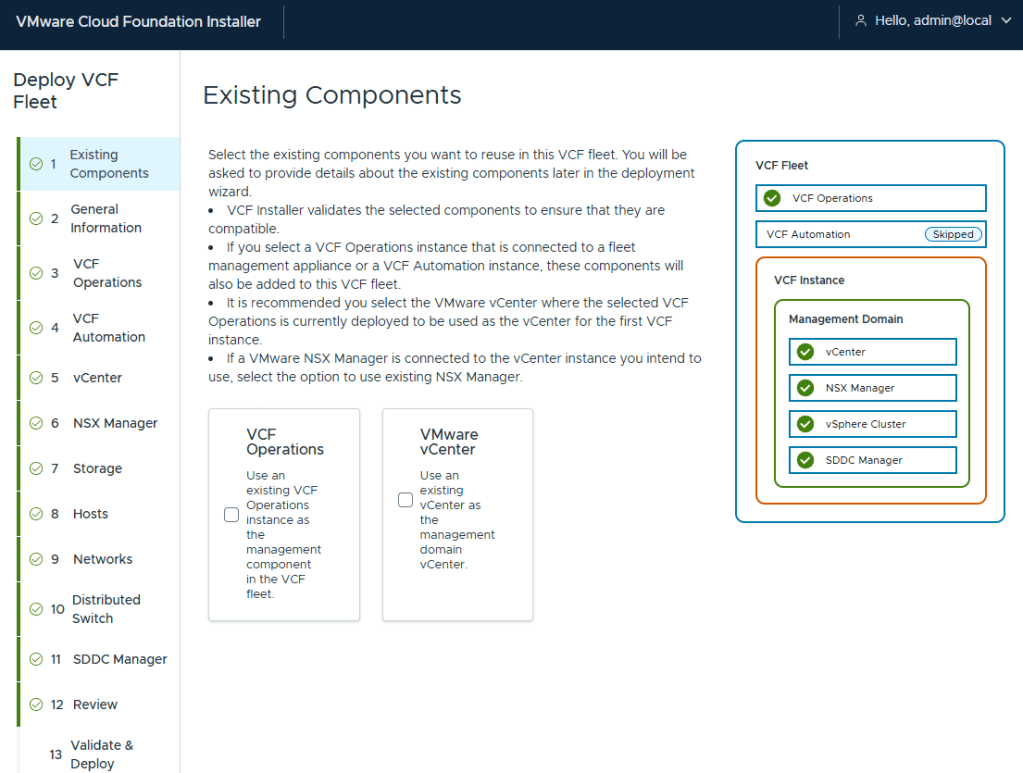
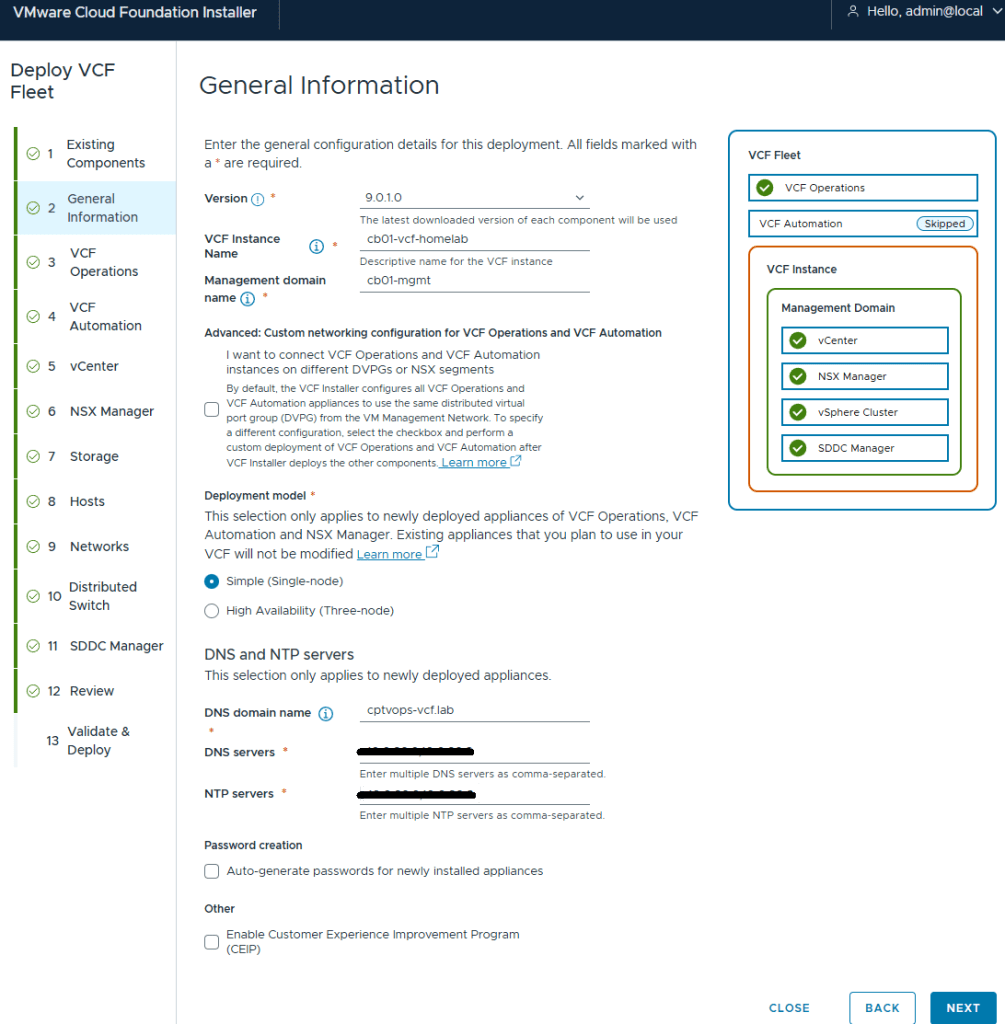
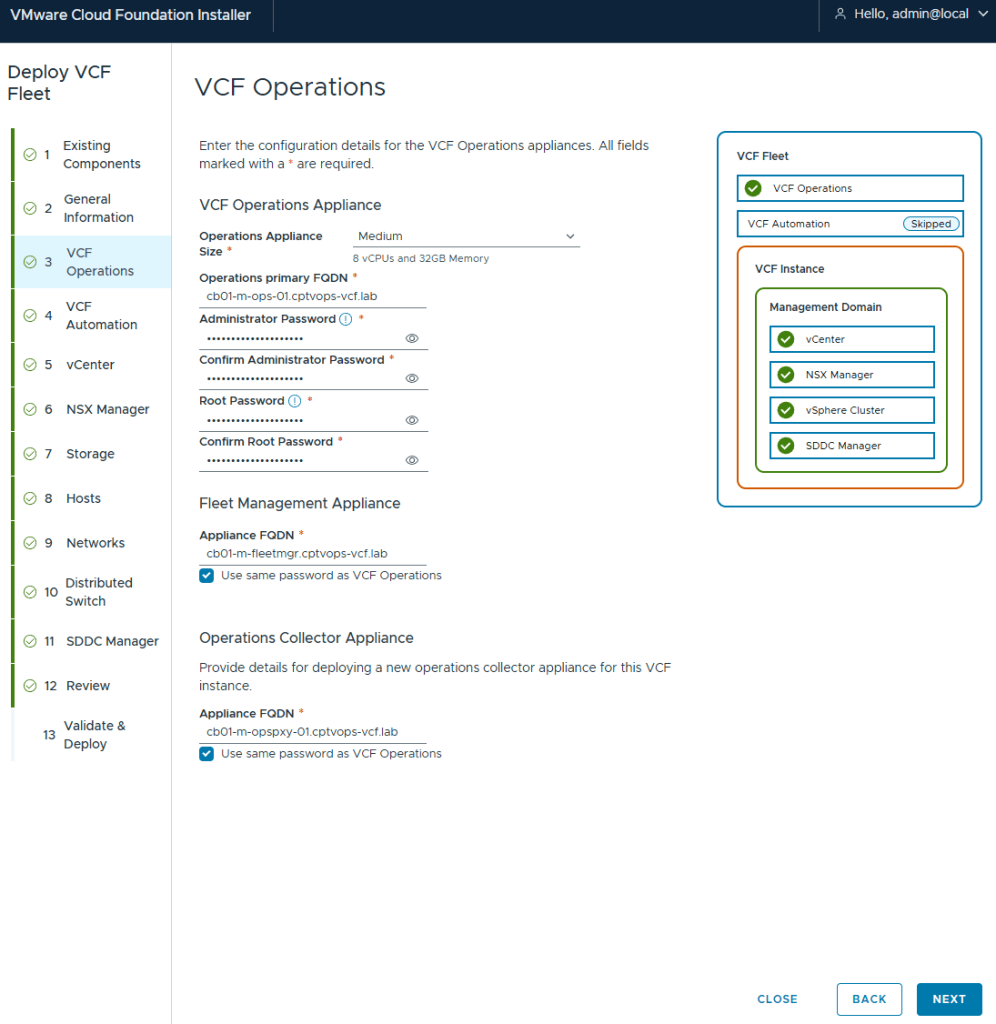
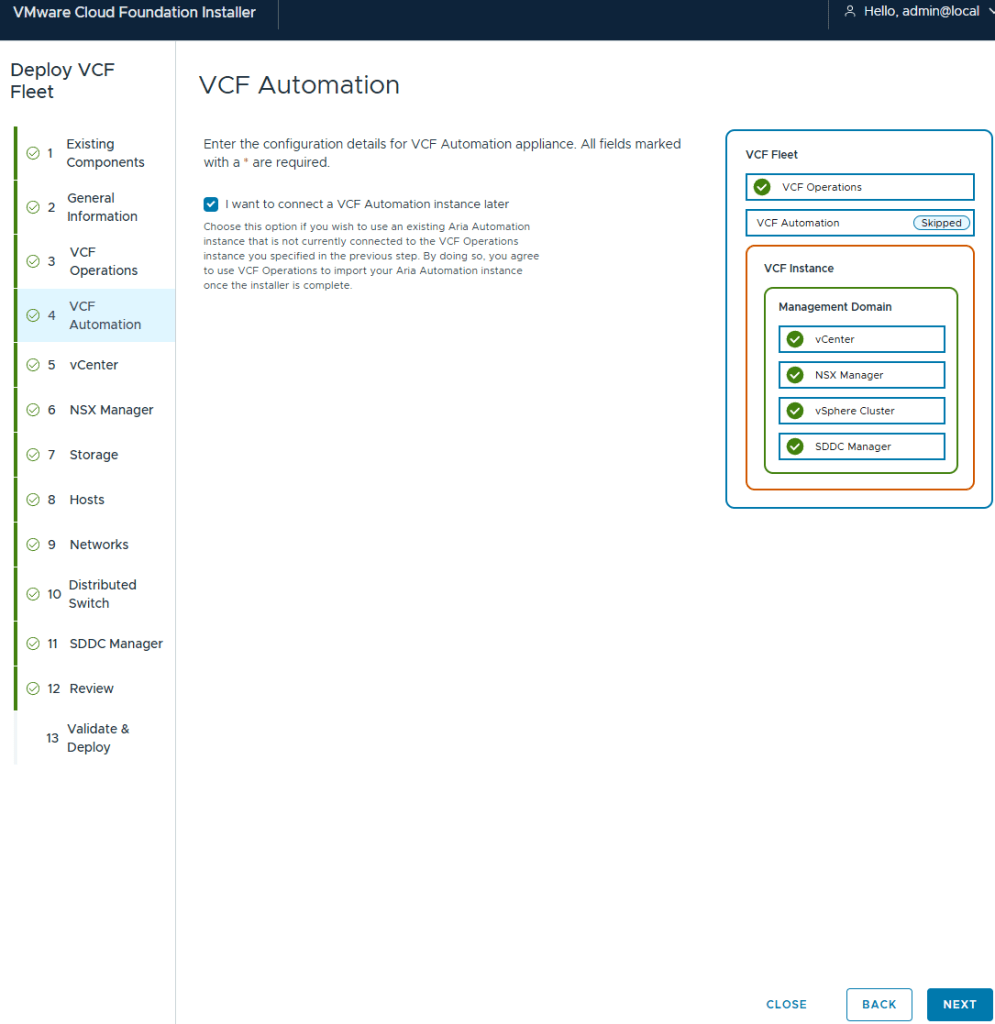
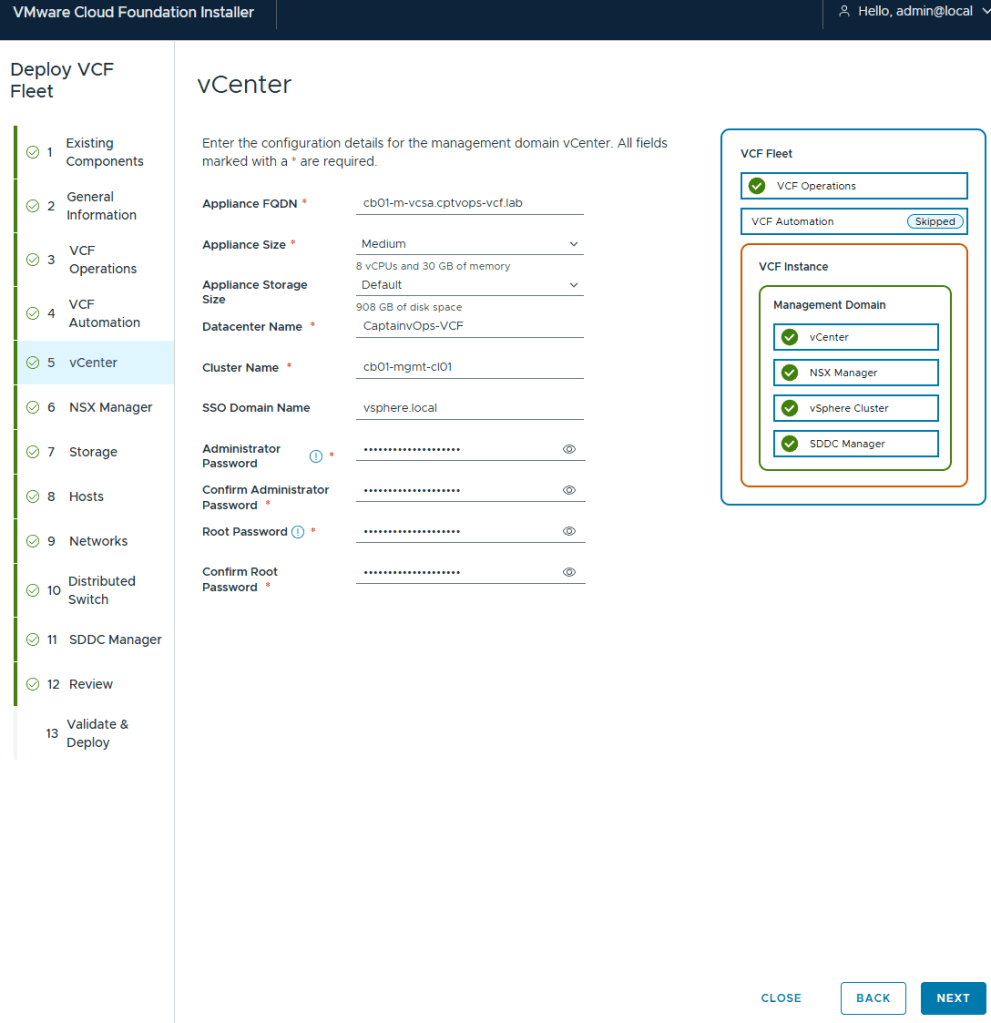
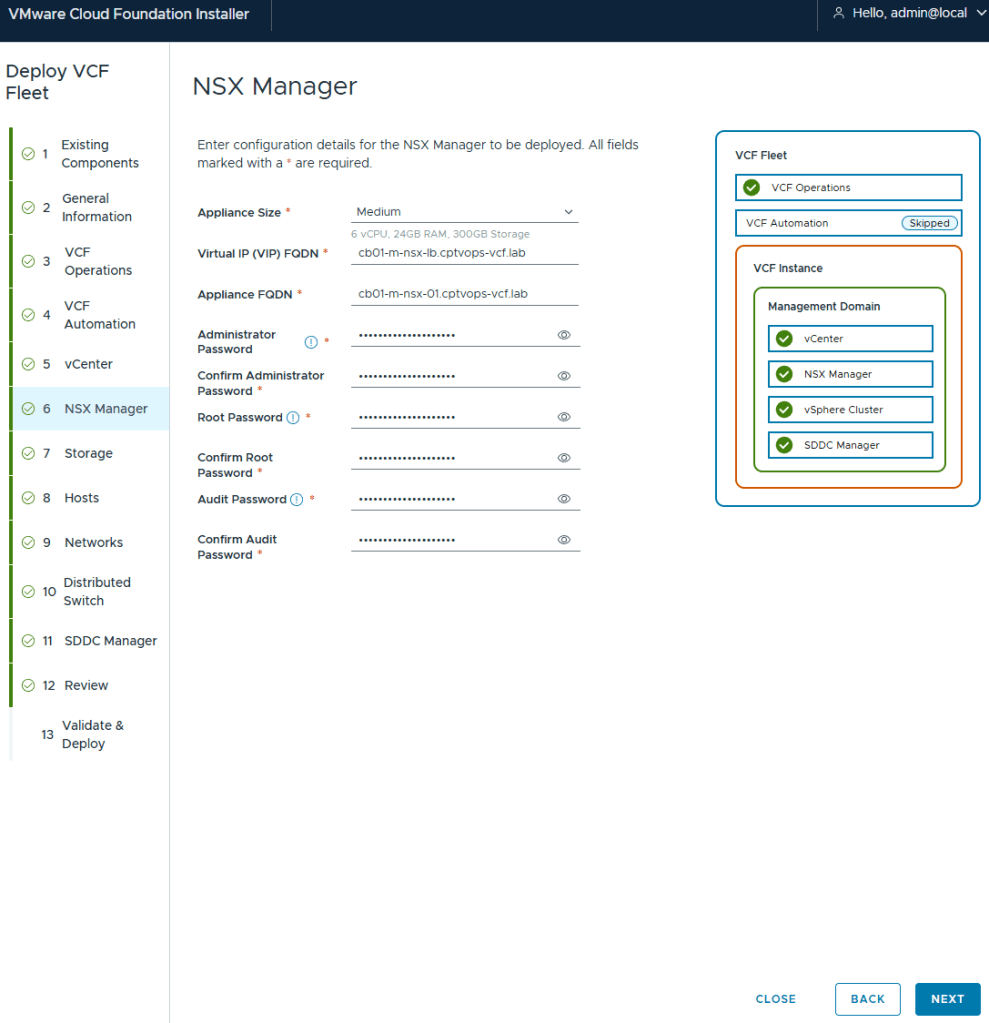
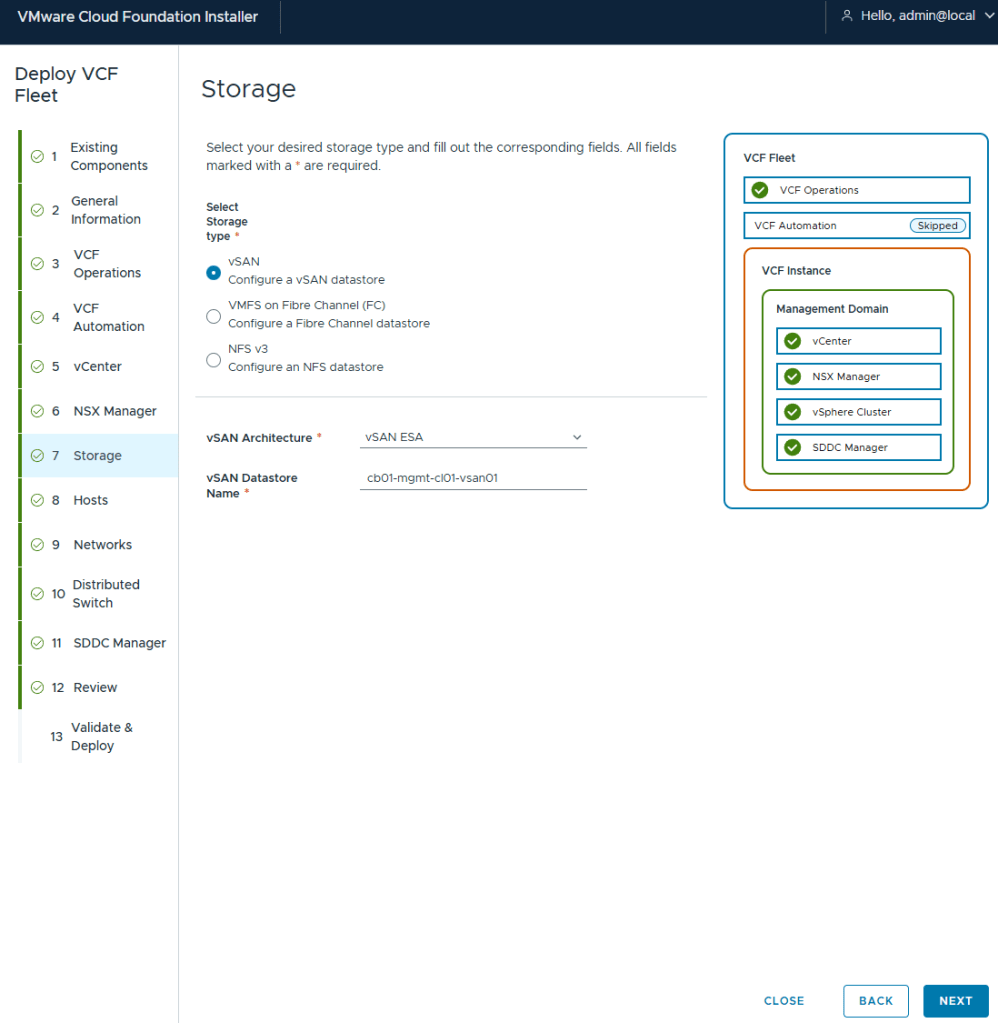
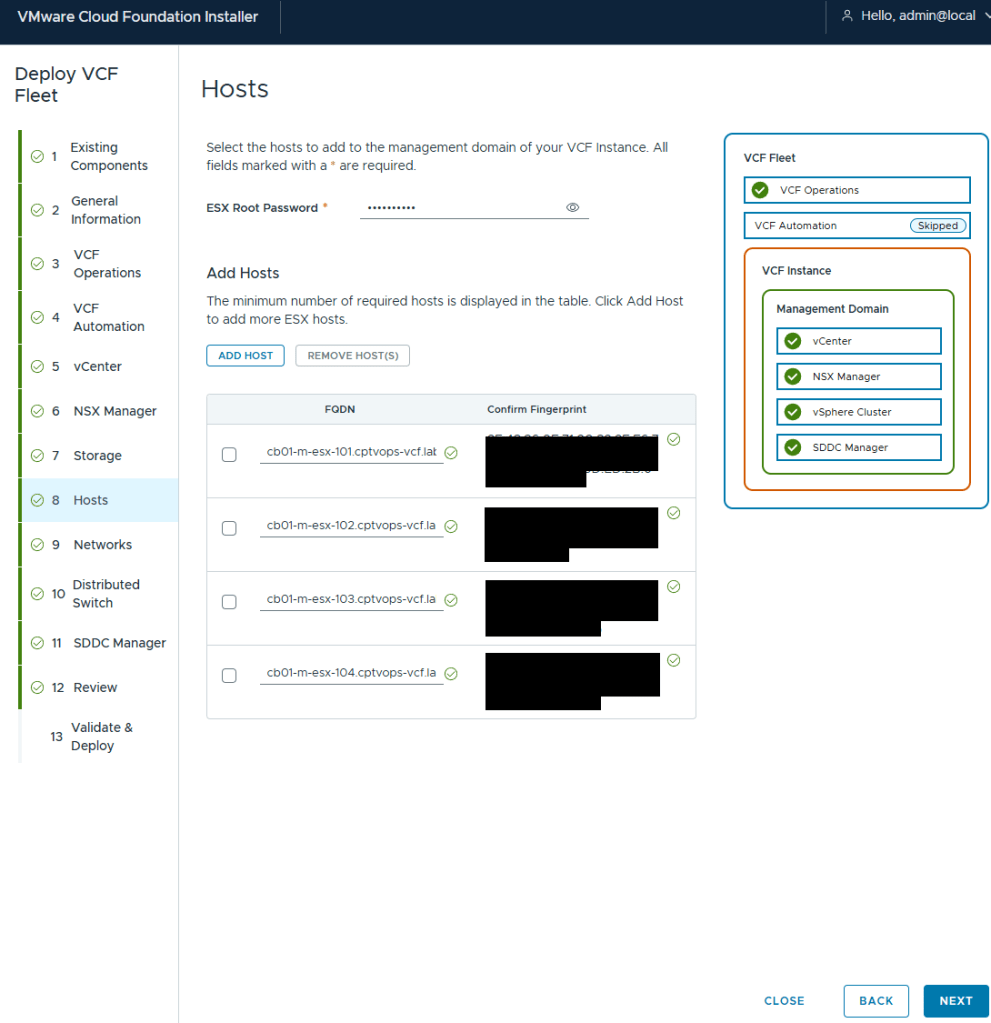
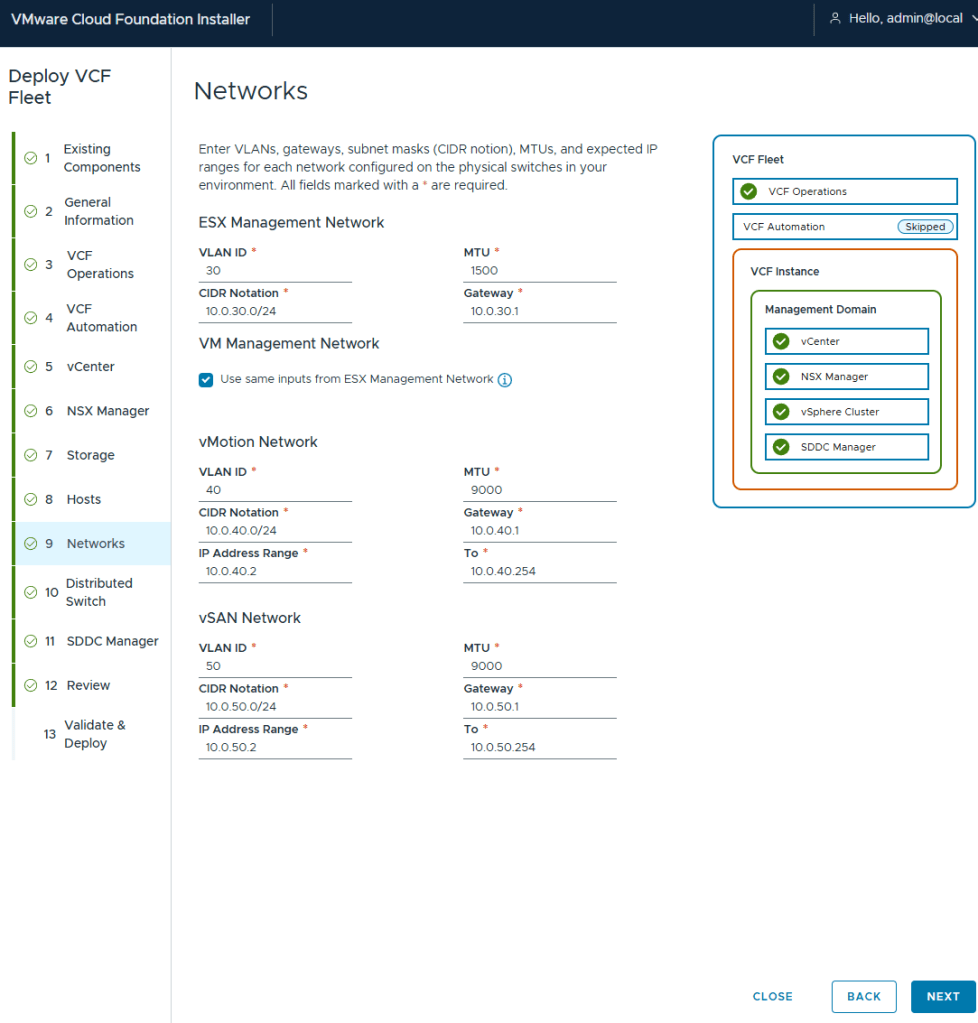
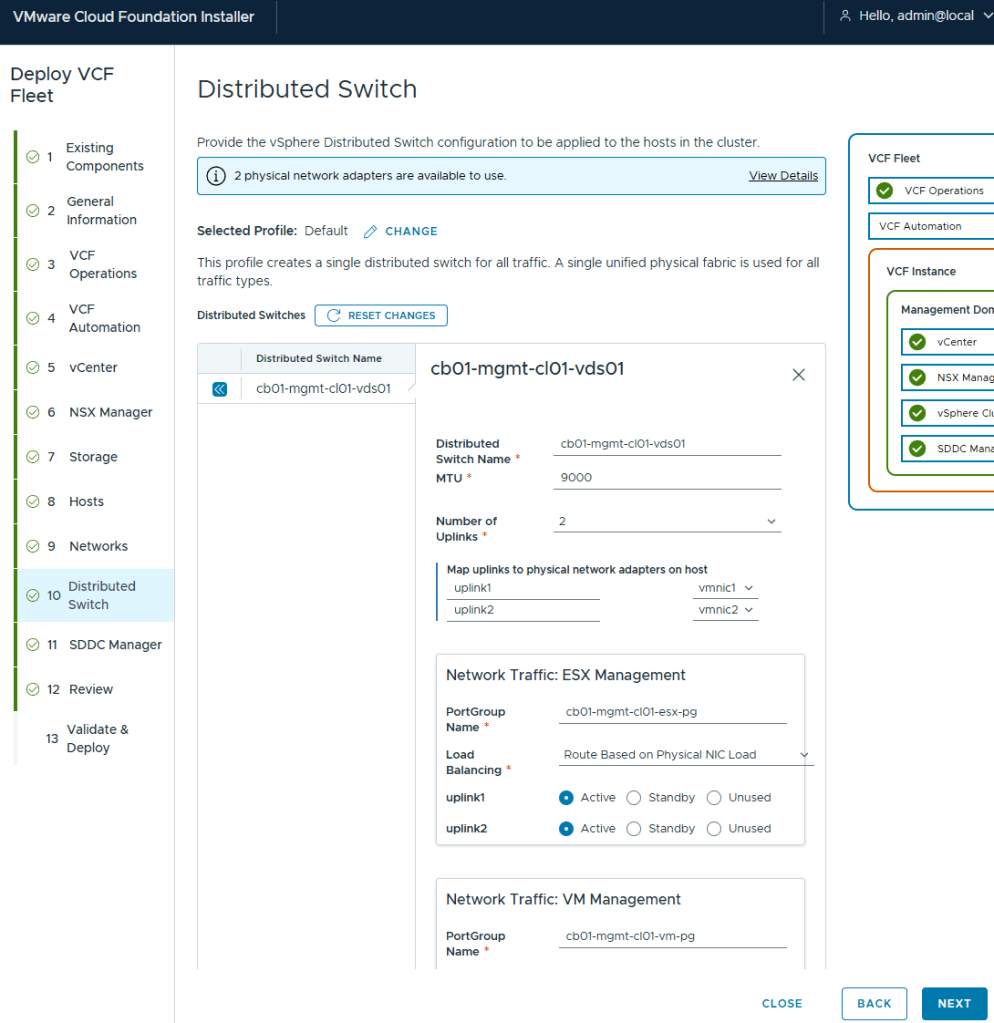
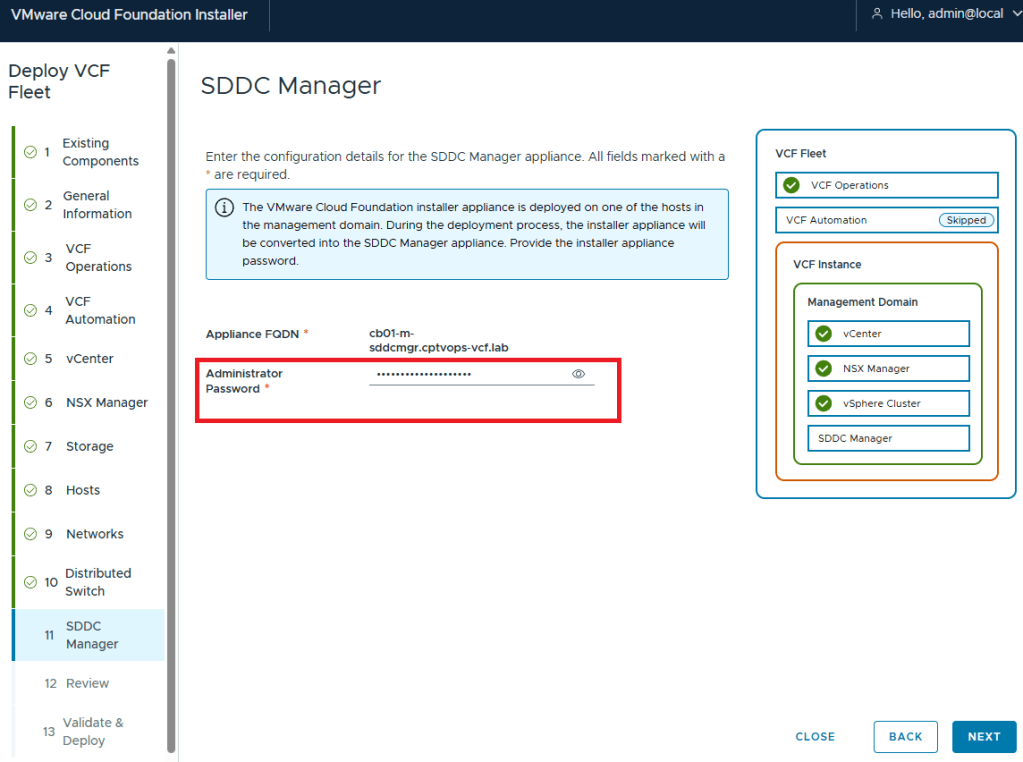
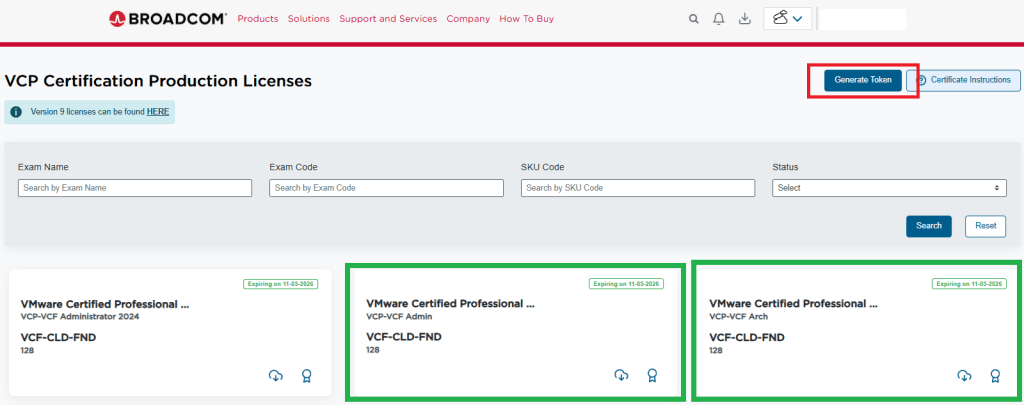
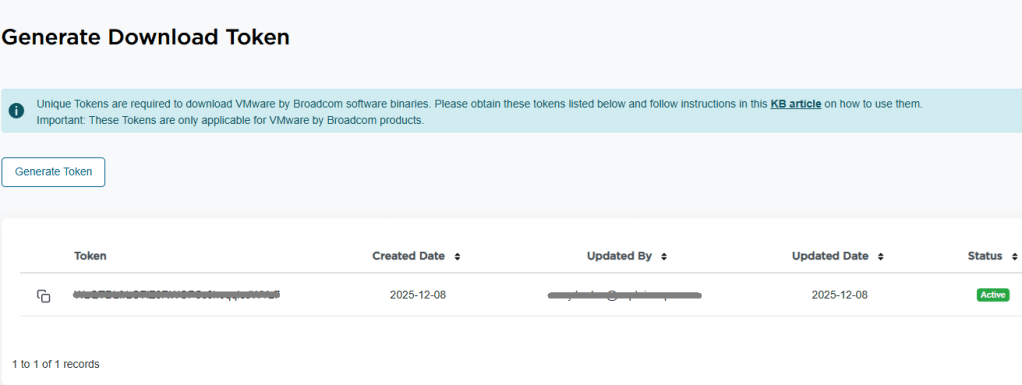
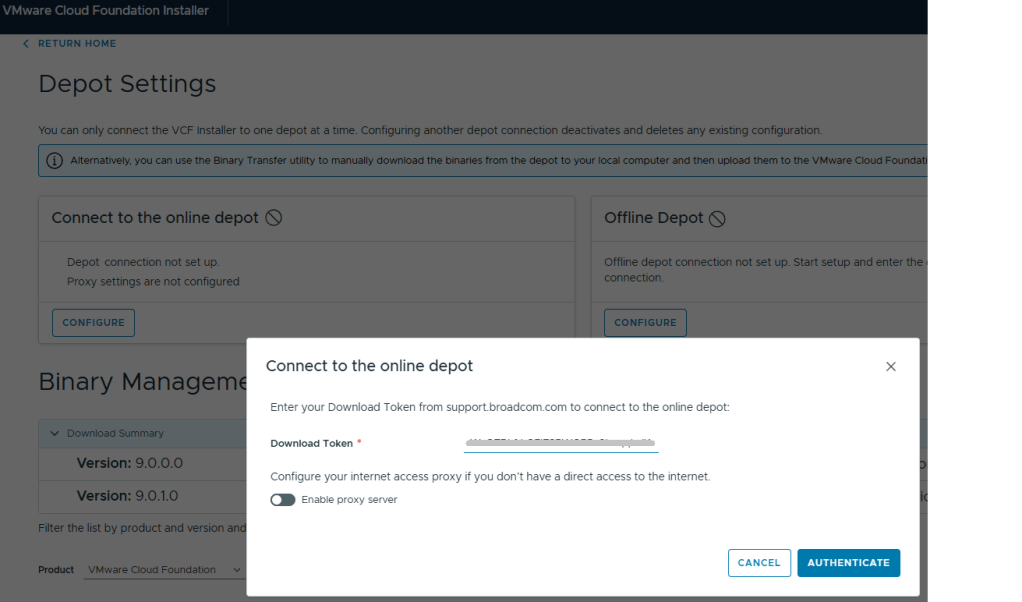
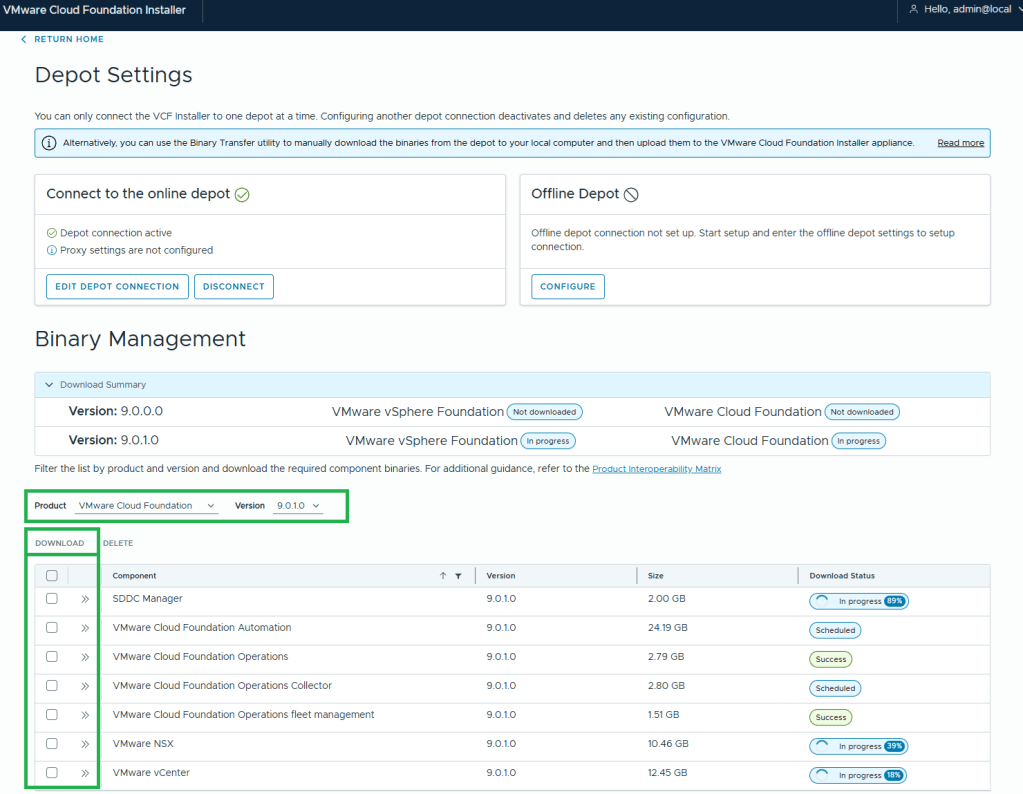
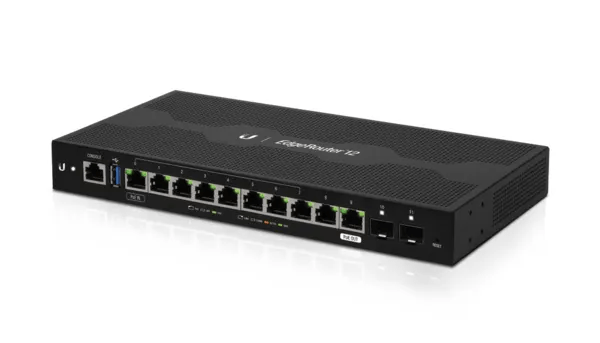
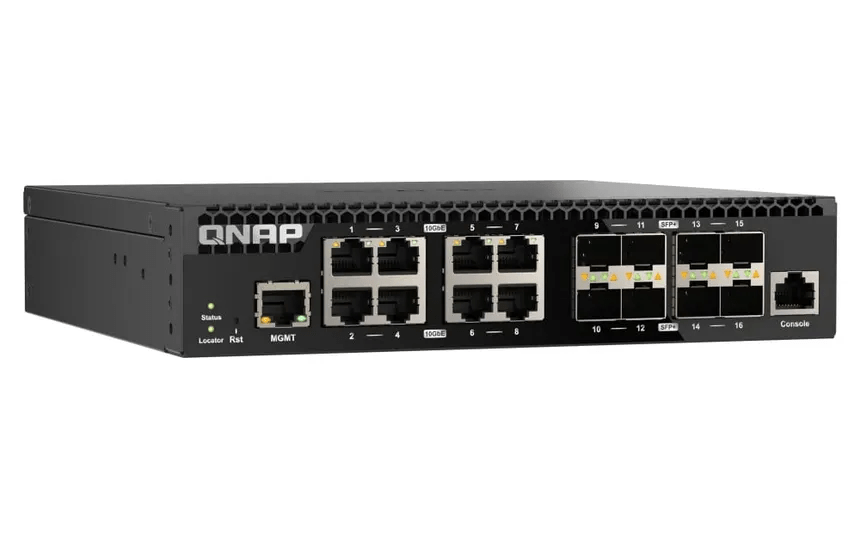
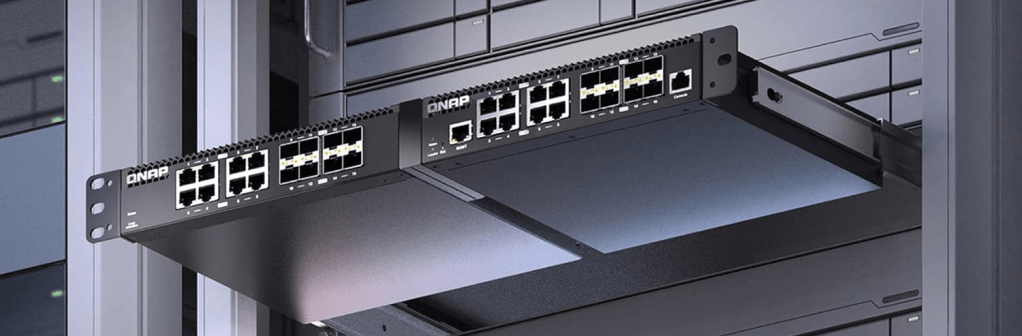
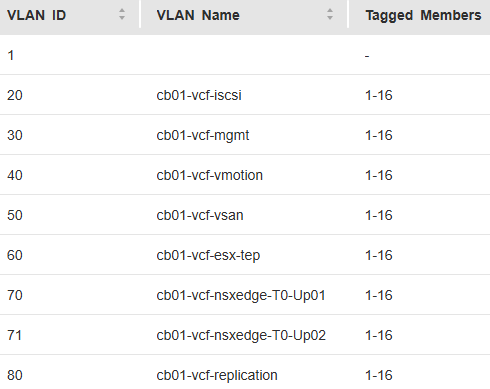
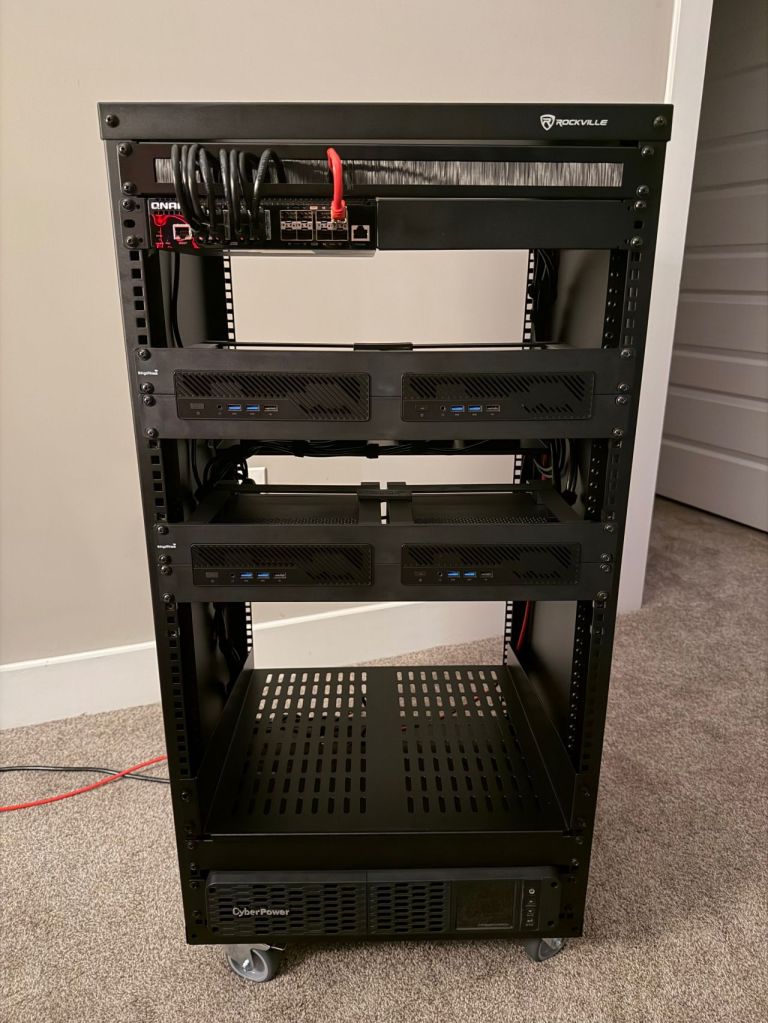
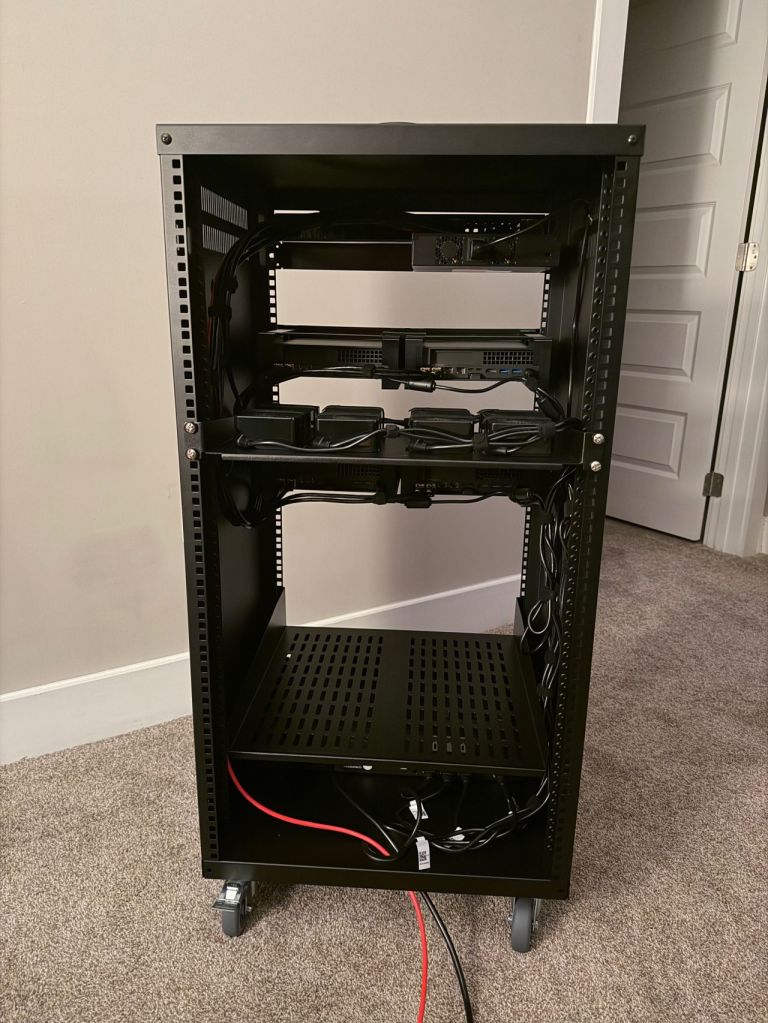
For anyone interested, I’ve bookmarked my VCF 9 Home Lab build here:
My VMware Cloud Foundation 9 Home Lab
Cheers,
Cory Barker


You must be logged in to post a comment.