Configuring VMware vRealize Operations Manager Object Groups

There are two sections I will cover in this post: ‘Group Types’ and ‘Object groups’.  An example of when you might want to consider creating a group type …lets say you have multiple data centers, a group type could be used as a way to group all objects types of that data center into one folder.  In other worlds: The group type for the data center in Texas would be used as a sorting container for the group objects such as data stores, vCenters, hosts, virtual machines, etc.. and keep them separated from the data center in New York.

The way you can do this is by clicking on the Content icon, selecting group types and then clicking the green plus sign to add a new group type.

vrops28

Next you can click on the environment icon (blue globe), Environment Overview, click the green plus icon to create a new object group, and then in the group type drop down, you can select the group type you just created.  As far as policy selection goes, the built in VMware policies are a great place to start.  You can easily update this selection later when you create a custom policy.  I would recommend checking ‘Keep group membership up to date’.

vrops29

Define membership criteria section.  This is where the water can get muddy as you will have more than one way to target your desired environment objects.  In the drop down menu ‘Select the Object Type that matches all of the following criteria’, the object types selection can grow in number depending how many additional adapter Management PAKs are installed on the vROps appliance.  This selection will also be important because of the way vROps alerts off from the management packs.

– An example would be alerts on Host Systems.  One would assume you would select the vCenter Adapter and then select Host Systems, however  if you have the vCloud Director Adapter Management PAK installed for example, that PAK also has metrics for Host Systems that vROps will alert from,  you would also need to select Host systems under that solution to target those alerts and systems as well.

vrops30

For this example, we will use the Host System under the vCenter Adapter.  There are different ways to target the systems, for this example I will showcase using Object name, contains option.  This option allows us to target several systems IF they have a common name like so:

vrops31

You also have the option to target systems based on their Relationship.  In this example we have clusters of hosts group under the name of MGMT, so I chose Relationship, Child of, contains, MGMT – to target all systems in that cluster like so:

vrops32

There is a Preview button in the lower left corner which you can use to see if your desired systems are picked up by the membership criteria you selected.

vrops33

You can also target multiple system names by using the Add another criteria set option like so:

vrops34

Depending on the size of the environment, I’ve noticed that it helps to make a selection in the ‘in navigation tree’ drop down as well

When you have the desired systems targeted in the group, click OK.  Groups are subject to the metrics interval collection, so the groups page will show grey question marks next to the groups until the next interval has passed.  Any policies that were applied to these custom groups will not change the alerts page until that metrics collection has occurred.

The added benefit to having custom groups is that vROps will also show you the group health, and if you click on the group name you will be brought to a custom interface with alerts only for that group of targeted systems.

vrops35

In my next post I will go over the creating of policies and how to apply them to object groups.


Next Post: Creating vROps Policies and How To Apply Them To Object Groups.

Previous Post: Add The vROps License, Configuring LDAP, and The SMTP For vRealize Operations Manager (vROps)


Nightly Automated Script To Gather VM and Host Information, and Output To A CSV

Admittedly this was my first attempt at creating a Powershell script, but thought I would share my journey.  We wanted a way to track the location of customer VMs running on our ESXi hosts, and their power state in the event of a host failure.  Ideally this would be automated to run multiple times during the day, and the output would be saved to a csv on a network share.

We had discovered a bug in vCenter 5.5 where if the ESXi 5.5 host was in a disconnected state, and an attempt was made to reconnect it using the vSphere client without knowing that the host was actually network isolated, HA would not restart the VMs on another host as expected.  We would later test this in a lab to find that if we had not used the reconnect option, HA would restart the VMs as expected on other hosts.  We again tested this scenario in vCenter 6 update 2, and the bug was not present.

So the first powercli one-liner I came up with was the following:

> get-vm | select VMhost, Name, @{N="IP Address";E={@($_.guest.IPaddress[0])}}, PowerState | where {$_.PowerState -ne "PoweredOff"} | sort VMhost

get-vm1

I wanted a list of powered on VMs, their IPs, what host they were running on, and I wanted to sort the output by the host name.  Knowing I was on the right track, now I wanted to be able to connect to multiple data centers, and have each data center’s output saved to a CSV on a network share.  I didn’t really need to hang on to the CSVs in that network share for more than seven days, so I also wanted to build in logic so that it would essentially cleanup after itself.

That script looks something like this:

#Initial variables
$vCenter = @()
$sites = @("vcenter01","vcenter02","vcenter03")

#get array of sites and establishes connections to vCenters
   foreach ($site in $sites) {
   $vCenter = $site + "domain.net"

   Connect-VIServer $vCenter

#get list of not equal to powered off VMs, there IP and which hosts they're running on
 get-vm | select VMhost, Name, @{N="IP Address";E={@($_.guest.IPaddress[0])}}, PowerState | where {$_.PowerState -ne "PoweredOff"} | sort VMhost | Export-Csv -Path "c:\path\to\output\$site $((Get-Date).ToString('MM-dd-yyyy_hhmm')).csv" -NotypeInformation -useculture

#Disconnect from vCenters 
 Disconnect-VIServer -Force -Confirm:$false -Server $vCenter

}

#Cleanup old csv after 7 days.
$limit = (Get-Date).AddDays(-7)
$path = "c:\path\to\output\"

Get-ChildItem -Path $path -Recurse -Force | Where-Object { !$_.PSIsContainer -and $_.CreationTime -lt $limit } | Remove-Item -Force

Something I did not know until after running this in a large production environment, is that the get-vm call is heavy and not very efficient.  When I ran this script in my lab it took less than 15 seconds to run.  However in a production environment, connecting to data centers all over the globe, it took over 40 minutes to run.

A colleague of mine who had automation experience, exposed me to another cmdlet called get-view, and said it would be much faster to run as it was more efficient gathering the data needed.  So I rewrote my script and now it looks like:

_________________________________________________________________

get-vm4-5


_________________________________________________________________

The new code took less than a couple of minutes to run in my production environment.  I have a Windows VM deployed that’s running the VMware poweractions fling, and it also runs some scheduled scripts.  This script would be running from that server, so I added an additional function to the script that creates a WIN event entry so it could be tracked from a syslog server.

So the final script can be downloaded here.  *Disclaimer – test this in a lab first as the code will need to be updated to suit your needs.


Add The vROps License, Configuring LDAP, and The SMTP For vRealize Operations Manager (vROps)

If you’ve been following my previous posts, I discussed what vRealize Operations Manager is, how to get the appliance deployed, how to get the master replica, data nodes and remote collectors attached to the cluster, and finally how to get data collection started.

Now it’s time to license vRealize Operations Manager.  This can be achieved by logging into the appliance via: < https ://vrops-appliance/ui/login.action >.  Next go into the Administration section, and there you’ll see Licensing.  Click the green plus sign to add the vROps license.

vrops23

About seven down from Licensing on the left hand column, you will see Authentication Sources.  This is where you configure LDAP.

vrops22

Again click the green plus sign to configure the LDAP source.

vrops24

Once the credentials have been added, test the connection and then if everything checks out click OK.

Lastly lets get the SMTP service configured,  about three down from Authentication sources you’ll find outbound settings.  Click the green plus to add a new smtp.

vrops25

Once you have the SMTP information added, test the connection, and if everything checks out click save.

vrops26

So now you should have a functioning licensed vrops instance.  In future posts I will cover creating object groups, policies, and configuring some alert emails.

Next Post: Configuring VMware vRealize Operations Manager Object Groups

Last Post: Configuring VMware vRealize Operations Manager Adapters For Data Collection

Configuring VMware vRealize Operations Manager Adapters For Data Collection

If you’ve followed my recent blog post on  Installing vRealize Operations Manager (vROps) Appliance, you are now ready to configure the built in vSphere adapter to start data collection.

Depending on how big your environment is, and IF you have remote collectors deployed, you may want to consider configuring collector groups.  A Collector group allows you to group multiple remote collectors within the same data center, and the idea is that this would allow for resiliency for those remote collectors, that way when you have the vROps adapters pointed to the collector group instead of the individual remote collector, if one of the remote collectors went down the other would essentially pick up the slack and continue collecting from that data center, so there would be no data loss.  You can also create a collector group for a single remote collector for ease of expansion later if you want to add that data collection resiliency.

Go ahead and get logged into the appliance using the regular UI <https//vrops-appliance/ui/login.action>.  From here click Administration.  If you just need to configure the vSphere adapter for data collection, you can skip ahead to Section 2.  Otherwise lets continue in section 1, and configure the collector groups.

Section 1

Click on Collector Groups

vrops11

You can see that I already have collector groups created for my remote data centers, but if you were to create new, just click the green plus sign

vrops12

Give the collector group a name, and then in the lower window select the corresponding remote collector.  Then rinse-wash-and-repeat until you have the collector groups configured.  Click Save when finished.  Now lets move on to Section 2.

Section 2

From the Administration area, click on Solutions

vrops10

Now because this is your new deployment, you would only have Operating Systems / Remote Service Monitoring and VMware vSphere.  For the purpose on this post I will only cover configuring the VMware vSphere adapter.  Click it to select it, and then click the gears to the right of the green plus sign.

vrops13

Here just fill out the display name, the vCenter Server it will be connecting to, the credentials, and if you click the drop down arrow next to Advanced Settings, you will see the Collectors/Groups drop down menu.  Expand that if you have created the custom collectors in Section 1, and select the desired group.  Otherwise vROps will use the Default collector group, which is fine if you only have one data center,  otherwise I recommend at least selecting a remote collector here if you do not have a collector group configured.  This basically puts the load onto the remote collectors for data collection, and allows the cluster to focus on processing all of that lovely data.  Click Test Connection to verify connectivity, and then click save. Then rinse-wash-and-repeat until you have all vCenters collecting.  Close when finished.

Important to note that vROps by default will collect data every five minutes, and currently that is the lowest setting possible. You can monitor the status of your solutions or adapters here.  Once they start collecting their statuses will change to green.

vrops17

If you’d like to add additional solutions otherwise known as “Management PAKs”, head on over to VMware’s Solution Exchange .  I currently work for a cloud provider running NSX, so I also have the NSX and vCloud Director Management PAKs installed.  From the same solutions page, instead of clicking on the gears, click the green plus sign and add the additional solutions to your environment.  This would also be used when you are updating solutions to newer versions.  Currently there is no system to update you when a newer version is available.

vrops14

Go to Global Settings on the Administration page, where you can configure the object history, or data retention policy, along with a few other settings.

vrops15

Finally, Go back to home by clicking the house icon.  By now the Health Risk and Efficiency badges should all be colored.  Ideally green, but your results may vary.  This is the final indication that vROps is collecting.

vrops16


Next Post: Add The vROps License, Configuring LDAP, and The SMTP For vRealize Operations Manager (vROps)

Recent Post: Sizing and Installing The VMware vRealize Operations (vROps) Appliance

Sizing and Installing The VMware vRealize Operations (vROps) Appliance

VMware has a sizing guide that will aid you in determining how many appliances you need to deploy.  If you have multiple data centers, and somewhere north of 200 hosts, and more than 5,000 VMs, I’d recommend at least starting out with two servers configured as Large deployments.  Once you get the built in vSphere adapter collecting for each environment, you can run an audit on the environment using vROps to get the raw numbers, and expand the cluster accordingly.  Come prepared.  Walk through your environments and get a list of how many hosts, data stores, vCenters, and get a rough count of the virtual machines deployed.

KB2093783 has more details on the sizing, and I strongly urge you to visit the KB, as there are links to the latest releases of vROps, and each KB has a sizing guide attachment at the bottom, where you can input the information you collected from your environment to get a more accurate size.

_________________________________________________________________

Appliance Manual Installation

________________________________________________________________

Architectural Note

  • Before proceeding be sure you have:
    • The appropriate host resources
    • The appropriate storage
    • IP addresses assigned and entered into DNS
    • a “read-only” account configured in AD and vCenter
    • The appropriate ports opened between data centers listed in VMWare’s documentation

_________________________________________________________________

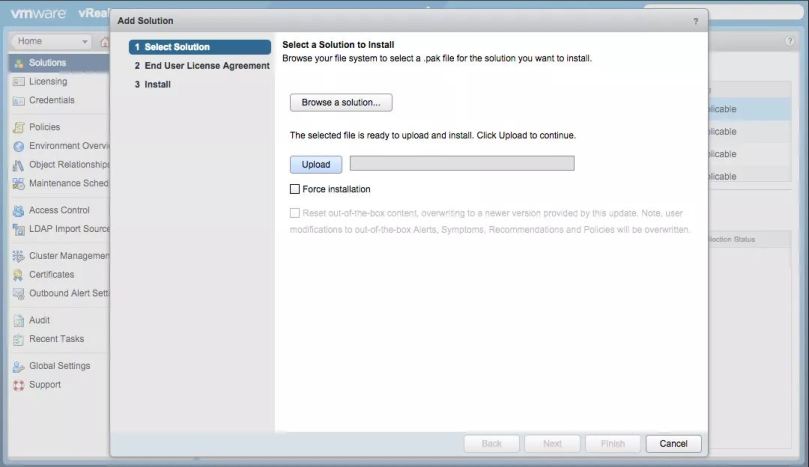
Once you have the latest edition of the vROps appliance ovf downloaded, and after consulting the documentation, use either the vSphere client or web, and deploy the OVF template.  I’ll skip through browsing for, verifying the details of, accepting the licence agreement for, and naming the appliance.

So now you’ve come to the OVF deployment step where you must select the size of your appliance.  No matter the size, the remainder of the deployment is the same, but for this example I will deploy an appliance as Large.

You can deploy the appliance in several sizing configurations depending on the size of your environment and those are: Extra Small, Small, Medium and Large.

  • Extra Small = 2 vCPUs and 8GBs of memory
  • Small = 4 vCPUs and 16GBs of memory
  • Large= 16 vCPUs and 48GBs of memory

You can also choose to deploy a remote collector and they come in two sizes:

  • Standard = 2 vCPUs and 4GBs of memory
  • Large = 4 vCPUs and 16GBs of memory

vrops1

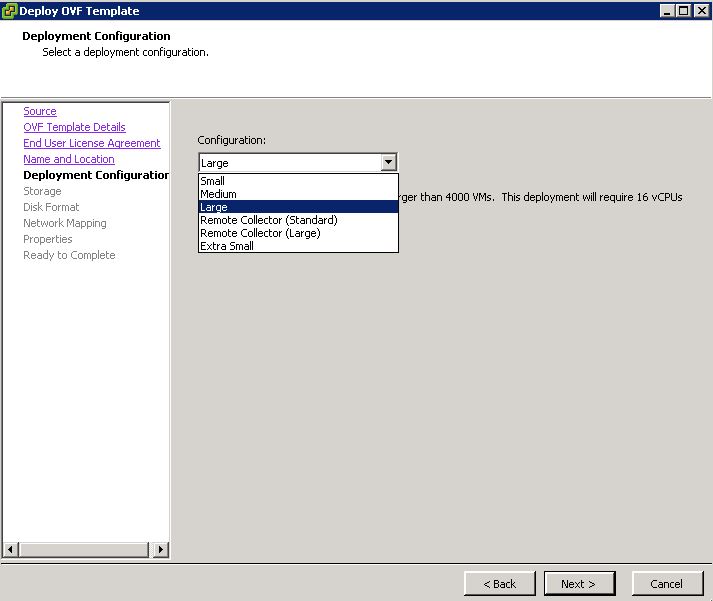
You will notice that with each selection, VMware has given a definition of what it entails. Choose the one that best suits your needs. Click next

Storage dialog

  • Depending on the size of your environment, vrops VMs can get to over a terabyte in size each
  • Once you’ve made your selection click next
  • Architectural Note – If adding a master replica node to your vROps cluster, I’d recommend keeping the Master and Master Replicas on separate XIVs, or whatever you use to serve up storage to your environment.

Disk Format dialog

  • The default is Lazy Zeroed, and that’s how my environments have been deployed.  I’d strongly advise not using thin provision for this appliance.
  • Once you’ve made your selection click next.

Network Mapping dialog

  • Select the appropriate destination network like a management network, where it can capture traffic from your hosts, VMs, vCenters and datastores.
  • Once you’ve made your selection click next.

Properties dialog

  • Here you can set the Timezone for the appliance, and choose whether to use IPv6
  • Once you’ve filled out the network information, click next

Configuration Verification dialog

  • Read it carefully to be sure there were no fat fingers at play.  Click finish when ready.

_________________________________________________________________

Before you proceed in turning on the appliance, you may want to take the opportunity now and expand its disk.  This can be done a couple of ways.  You can expand the existing Hard Disk 2, however keep in mind that the current file system can only see disks under 2TB.  Any disk space allocated over 2TB the appliance wont be able to see.  For my production environment, I increased disk 2 to 1TB in size, and then added 500GB disks as more storage was needed.  Also keep in mind the amount of data you are going to be retaining.  My appliances are configured for 6 months, but this can be changed as needs change.  We’ll go over this later in another post. The cool thing about this appliance is that as you increase the size of disk 2, or add additional storage, the appliance during the power-on process, expands the data partition automatically.

Power up the appliance, open a console to it in vCenter to watch it boot up, and go through some scripted configurations.

vrops4

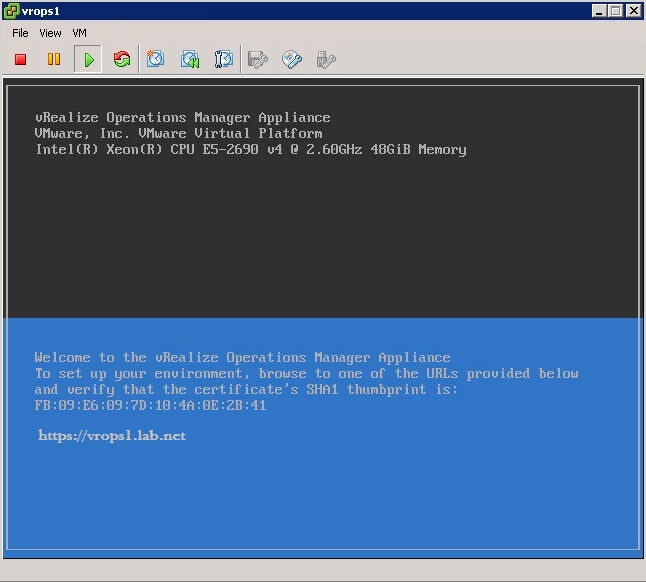
  • To get logged in, press ALT + F1 keys.  Enter root for the user, leave the password blank and hit enter.  Now you will be prompted to input the current password, so leave it blank and hit enter.  Now enter a new password, hit enter and enter the new password once more for verification.
  • Now depending on how locked down your environment is, you may not be able to but I always ping out to 8.8.8.8 along with hitting a few internal servers to verify network settings.
  • Also unless you really enjoy VMware’s console, I’d recommend running a couple commands to turn on SSH, so any future administrative tasks can be performed with a putty session.
    • The first command is:  # chkconfig sshd on
      • This enables the sshd service at system boot
    • The second command is: # service sshd start
      • This turns on the sshd service so you can connect to the box with a putty session.

_________________________________________________________________

Using Microsoft Edge, Firefox or Chrome, browse to < https ://vrops-appliance-name/ >.  This will redirect you to the Getting started page where you can choose Three options:

Express Installation, where you can set the admin password and that’s pretty much it.

vrops8

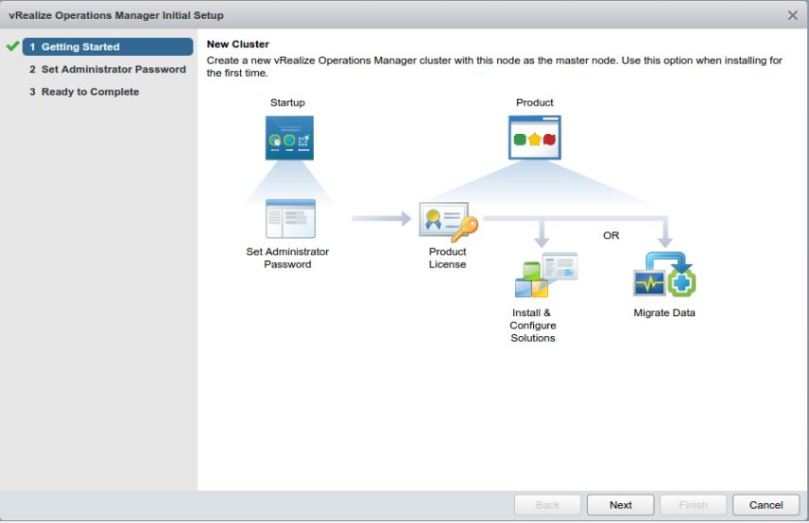
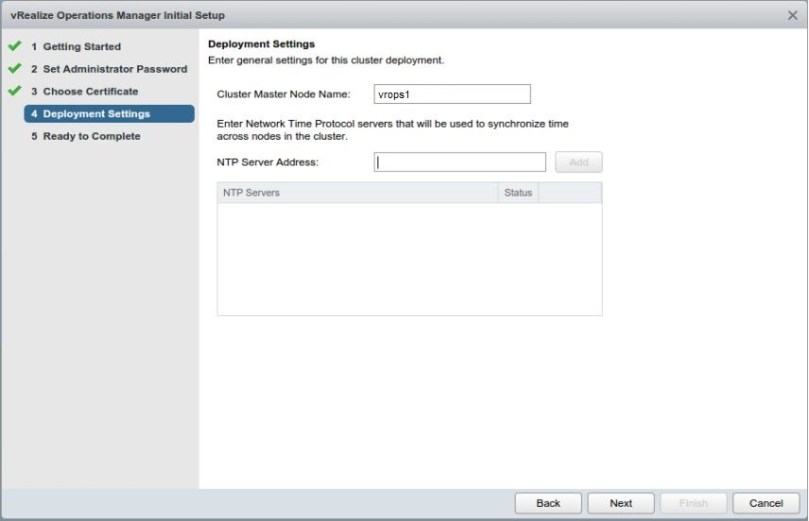
New Installation gives you a few more options to configure, like which NTP server(s) you want to use, and a TLS/SSL certificate you’ve created specifically for this system (or just use the built-in one).

vrops5

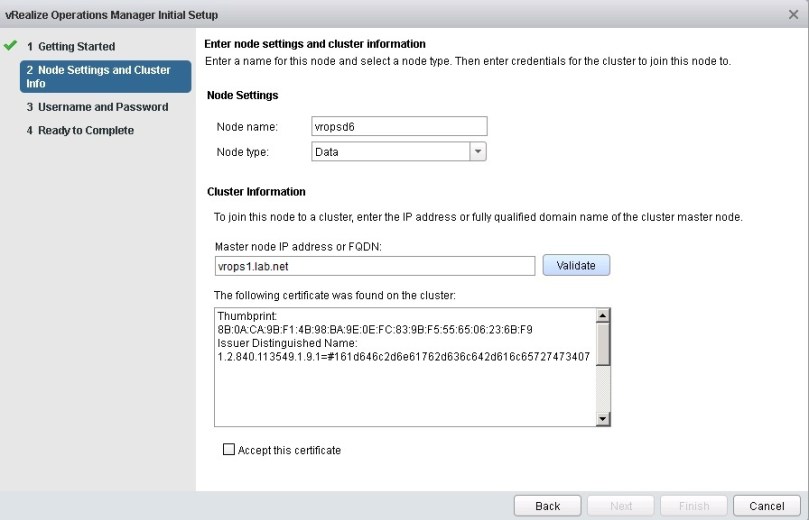
Expand An Existing Installation – this option would be used for additional data nodes or remote collectors as you’ll have the option to pick under “node type”.

vrops6

For this installation we will select New Installation.  As a rule of thumb and for better appliance performance, I’d use the NTP servers on your network that vCenter and the ESXi hosts are using to keep time in check. Once you’ve made it though the wizard click finish.

vrops9

It shouldn’t take too long for the master appliance to setup and take you to a log in screen.

You’re not done yet however. You still have to configure your cluster if you have additional data nodes, and remote collectors to add.  If you have a master replica, data nodes, or remote collector, get them connected to the master.  Each will have their own web UI  < https ://vrops-appliance-name/ >, only this time you can use the Expand An Existing Installation Option. You will also need to log into the admin section for some of this <https ://vrops-appliance-name/admin/login.action>

Lets get the master replica added first.  When you use the expand an existing cluster option, you’ll need to add it as a data node.  Then wait for the cluster to expand to it.

vrops18

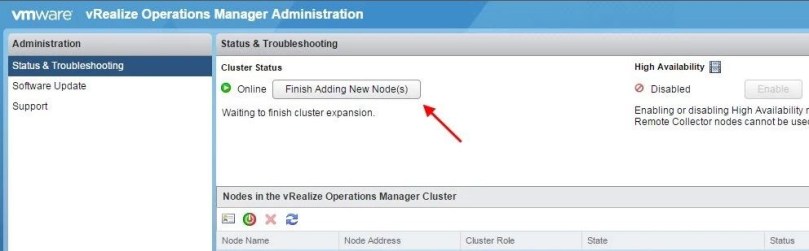
Then click the finish adding new nodes button.

vrops19

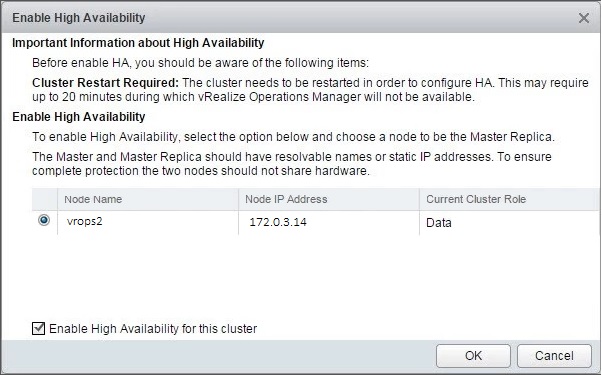
To enable HA, you’ll notice in the center of the screen there is a High Availability option, but it is disabled.  Go ahead an click enable

vrops20

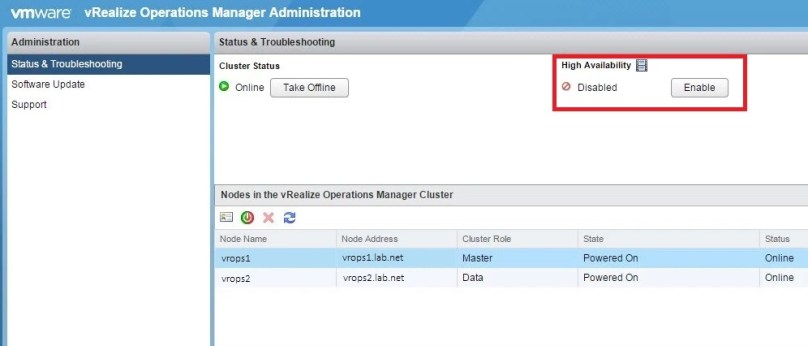
Now select the data node that will be the master replica, make sure enable high availability is checked, and click OK.  This part will take a little while, and the cluster services will be restarted.  After word the High Availability status will be enabled.

vrops21

Add any remaining data nodes and remote collectors using the Expand An Existing Installation Option.

_________________________________________________________________

Architectural Note

  • I’d recommend going into vCenter and adding an anti-affinity rule to keep the master and master replica on separate hosts
  • If you’ve deployed vROps to its own host cluster, I’d recommend turning down vSphere DRS to conservative.  The appliances are usually pretty busy in an active environment, and having one vmotion on you can cause cluster performance degradation, and will throw some interesting alarms within vROps.  It will recover on its own, but better to avoid when possible.

_________________________________________________________________

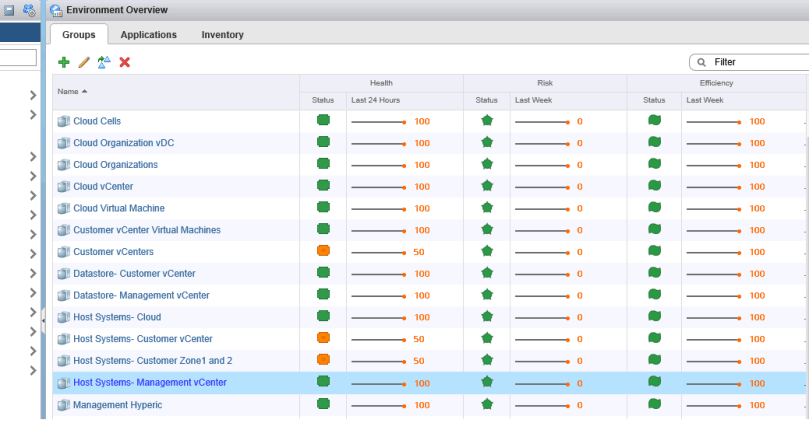
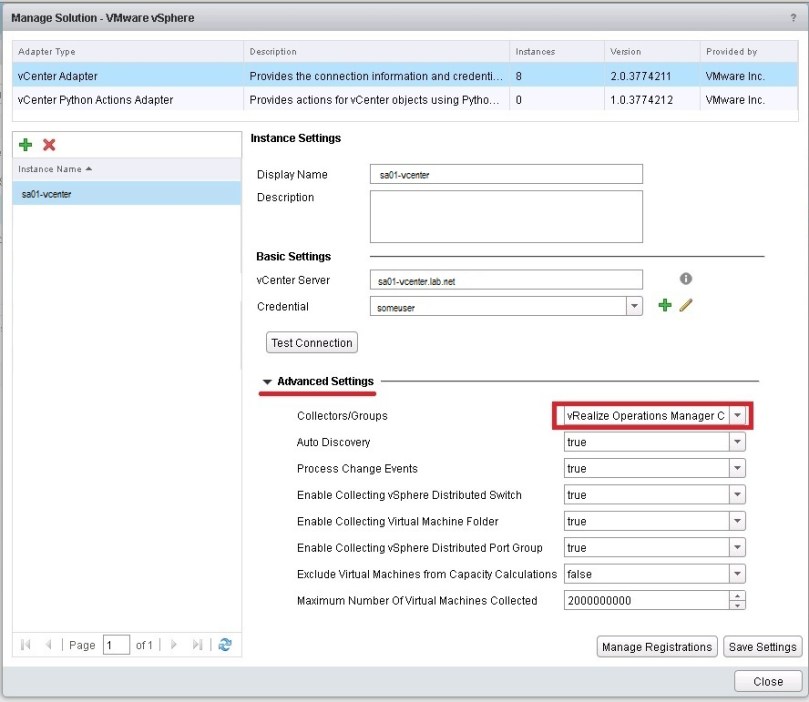
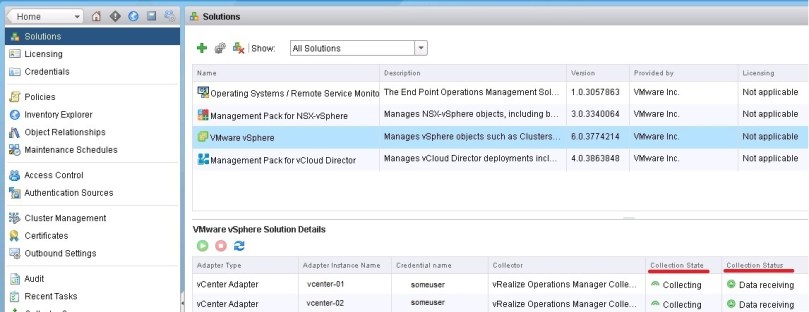
Next up – You”ll need to configure the built in vSphere adapter so you can start collecting data.  I’ll have more on that in my next post.

Next Post: Configuring VMware vRealize Operations Manager Adapters For Data Collection

Recent Post: What Is VMware’s vRealize Operations Manager?

What Is VMware’s vRealize Operations Manager?

Formally Known as vCenter Operations (vCOps), vRealize Operations Manager (vROps) really has become the center of the vSphere universe.  vROps is an appliance that sits in your environment collecting system metrics from vCenter, virtual servers and ESXi. It acts as the single pane of glass to the virtual environment, allowing the administrator to track and mitigate resource contention, along with performance and capacity constraints.  vROps will also “learn” about the environment, and given a couple of months, the data collection can be used to perform future calculations to determine things like when more capacity is required based on growth and resource consumption, and that’s pretty cool.  Data collection is not just limited to VMware products however, you can also install additional management PAKs from VMware’s Solutions Exchange, and there are always more being added.  Which brings us to the next topic: Sizing your vROps deployment.

Unlike vCOps which consisted of two virtual machines within a vApp, vROps is a single virtual appliance, that can be expanded and clustered for additional compute resources.  A single appliance or node can be deployed and looks like the following in figure 1:

Figure 1 – A single vROps node

vropsnode

Now the cool thing about vROps is that it has the built in functionality of clustering two appliances together as a Master and Master Replica, giving you resiliency in case of a failure.  You can also add additional nodes to the cluster known as Data nodes, that will allow you to collect and process even more metrics.  It should go without saying, but as you add more Management PAKs from VMware’s solution exchange, keep in mind that you may need to add additional data nodes.  It’s also important to note that the master and master replica servers can also be referred to as data nodes, and that is important because since vRealize Operations Manager 6.x, you can have a total of 16 data nodes in a cluster. That means you can have an HA pair, and 14 additional data nodes.  You can deploy the appliance in several sizing configurations depending on the size of your environment and those are: Extra Small, Small, Medium and Large.

  • Extra Small = 2 vCPUs and 8GBs of memory
  • Small = 4 vCPUs and 16GBs of memory
  • Large= 16 vCPUs and 48GBs of memory

You can also deploy additional appliances known as a Remote Collector, and since vRealize Operations Manager 6.1.x, you can have a total of 50 remote collectors, allowing the collection from 120,000 objects and 30,000,000 individual metrics.  Now that’s a lot of data!  Now these remote collectors come in different size configurations as well.

  • Standard = 2 vCPUs and 4GBs of memory
  • Large = 4 vCPUs and 16GBs of memory

In figure 2, this is what a clustered installation would look like and where remote collectors fit in.

Figure 2 – A vROps cluster

vropscluster

As you can see, the main cluster or the master, replica and data nodes all share a database and analytics processing engine, but the remote collector does not.  It’s goal is simply to act as a vacuum, to collect and push the metrics collected from those remote data centers back to the main cluster for processing and storage.

All together this makes for a fantastic resource for troubleshooting and metrics data retention for historical data.  I will caution that the vROps appliance requires a lot of CPU and memory depending on your environments configuration, and you should be sure to have ample resources supporting it.  To get the most from this appliance, I’d also recommend at least one dedicated engineer to vROps, as there is a great deal of information to be had, and much to configure and maintain.

A Final Word

As someone who has been responsible for several large deployments, I can tell you this appliance has come a long way from its former days as VMware vCenter Operations Manager, and the developers dedicated to this platform are hard at work making it even better as it becomes the center of the software defined datacenter universe, within the VMware stack.

There are excellent blogs over at VMware that dives deeper into this appliance and it’s capabilities.  For more information visit their site via blogs.vmware.com


An Engineer’s Guide To The Galaxy Using KeePass

If you’re like me, and have multiple cloud environments, and multiple servers to manage, the task can be quite daunting.  There are many paid for utilities out there that can help you with this task, but I’ve found that a utility called: KeePass Password Safe, does the job flawlessly if you are willing to do some custom configurations.  KeePass is not just for IT engineers, it’s free and open source so anyone can use it.  It really is the modern day Swiss Army knife for all geeks alike.

_________________________________________________________________

The Benefits

  • The database is encrypted using the most secure and best known algorithms AES and Twofish.
  • It is password protected, so assuming you are following password best practices, the KeePass database with your environment variables will remain secure if it is misplaced.
  • You can use KeePass from your local box, plus drop the same database file onto a jump server within your environment, to easily setup a secondary base of operations for yourself.
  • IT IS FREE. Open source too (OSI certified).

You Know You Want It

_________________________________________________________________

Now, there are many platforms that support KeePass, but this post will focus on Windows, as the majority of legacy IT departments are not too keen on running Linux or OSX in their environments, although those two platforms are quickly gaining traction in the modern era of hyper converged infrastructure.

The two key features I will focus on in this post are the abilities to use KeePass to open SSH and RDP sessions.  Assuming you already have KeePass installed, go into the Tools menu and then click Options

keepass1

Now go to the Integration tab in the options window, and click the URL Overrides button

keepass2

We will be creating two custom URL Override entries one for SSH (putty session) and the other for RDP (Microsoft Remote Desktop)

Click the Add button to get started:

keepass3

Assuming you installed Putty to its default directory, you need to tell KeePass where to find the executable. You can call Scheme whatever you wish, but for simplicity ssh was chosen for this example.

keepass4
Scheme: ssh
URL override: cmd://”C:\Program Files (x86)\PuTTY\PuTTY.exe” -ssh {URL:RMVSCM}

Click OK when finished.

Now for RDP sessions we will need to string together several commands in order to get the desired result. Here we are calling MSTSC (RDP) through the command prompt, configuring a timeout, and passing through credentials. You can call Scheme whatever you wish, but for simplicity rdp was chosen for this example.

Click Add button again

Scheme: rdp
URL override: cmd:// cmd /c “cmdkey /generic: TERMSRV/{URL:RMVSCM} /user:{USERNAME} /pass:{PASSWORD} && mstsc /v:{URL:RMVSCM} && timeout /t 5 /nobreak && /delete:TERMSRV/{URL:RMVSCM}”

Click OK when finished.

Now in KeePass when you create a new “entry”, you can enter a URL of rdp://ipaddress (or name of server) and KeePass will open a rdp session whenever you click on the link.  Likewise if you create a new “entry” for a putty session to a Linux box or network appliance, you can enter a URL of ssh://ipaddress and KeePass will open a putty session whenever you click on the URL link when you select your various entries.  In both cases you should specify a user account to use as RDP links especially need this to work.

There you have it.  Now you can build out the KeePass database with custom links to your various systems, to aid you in your quest in mastering your environment.