There is a known issue when upgrading the NSX host VIB from 6.1.X to 6.2.4, where once the host is upgraded to VIB 6.2.4, and the virtual machines are moved to it, if they should somehow find their way back to a 6.1.X host, the VM’s NIC will become disconnected causing an outage. This has been outlined in KB2146171
Resolution
We found the following steps to be the best solution in getting to the 6.2.4 NSX VIB version on ESXi 6u2, without causing any interruptions in regards to the network connectivity of the virtual machines.
- Log into the vSphere web client, go to Networking & Security, select Installation on the navigation menu, and then select the Host preparation tab.
- Select the desired cluster, and click the “Upgrade Available” message next to it. This will start the upgrade process of all the hosts, and once completed, all hosts will display “Reboot Required”.
- Mark the first host for maintenance mode as you normally would, and once all virtual machines have evacuated off, and the host marked as in maintenance mode, restart it as you normally would.
- While we wait for the host to reboot, right click on the host cluster being upgraded and select Edit Settings. Select vSphere DRS, and set the automation level to Manual. This will give you control over host evacuations and where the virtual machines go.
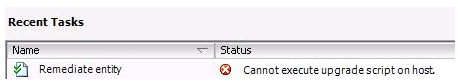
- Once the host has restarted, monitor the Recent Tasks window and wait for the NSX vib installation to complete.
- Bring the host out of maintenance mode. Now migrate a test VM over to the new host and test network connectivity. Ping to another VM on a different host, and then make sure you can ping out to something like 8.8.8.8.
- Verify the VIB has been upgraded to 6.2.4 from the vSphere web Networking & Security host preparation section.
- Open PowerCLI and connect to the vCenter where this maintenance activity is being performed. In order to safely control the migration of virtual machines from hosts containing the NSX VIV 6.1.X to the host that has been upgraded to 6.2.4, we will use the following command to evacuate the next host’s virtual machines onto the one that was just upgraded.
Get-VM -Location "<sourcehost>" | Move-VM -Destination (Get-Vmhost "<destinationhost>")
- “sourcehost” being the next host you wish to upgrade, and the “destinationhost” being the one that was just upgraded.
9. Once the host is fully evacuated, place the host in maintenance mode, and reboot it.
10. VMware provided us with a script that should ONLY be executed against NSX vib 6.2.4 hosts, and does the following:
- Verifies the VIB version running on the host.
For example: If the VIB version is between VIB_VERSION_LOW=3960641, VIB_VERSION_HIGH=4259819 then it is considered to be a host with VIB 6.2.3 and above. Any other VIB version the script will fail with a warningCustomer needs to make sure that the script is executed against ALL virtual machines that have been upgraded since 6.1.x. - Once the script sets the export_version to 4, the version is persistent across reboots.
- There is no harm if customer executes the script multiple times on the same host as only VMs that need modification will be modified.
- Script should only be executed NSX-v 6.2.4 hosts
I have attached a ZIP file containg the script here: fix_exportversion.zip
Script Usage
- Copy the script to a common datastore accessible to all hosts and run the script on each host.
- Log in to the 6.2.4 ESXi host via ssh or CONSOLE, where you intend to execute the script.
- chmod u+x the files
- Execute the script:
./vmfs/volumes/<Shared_Datastore>/fix_exportversion.sh /vmfs/volumes/<Shared_Datastore>/vsipioctl
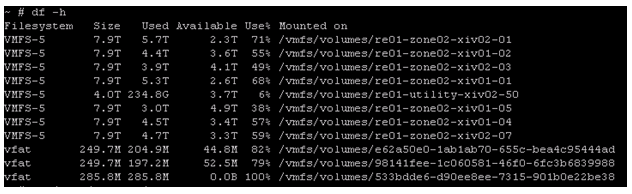
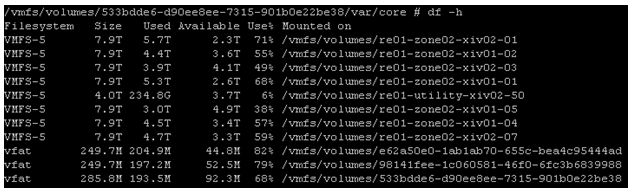
Example output:
~ # /vmfs/volumes/NFS-101/fix_exportversion.sh /vmfs/volumes/NFS-101/vsipioctl
Fixed filter nic-39377-eth0-vmware-sfw.2 export version to 4.
Fixed filter nic-48385-eth0-vmware-sfw.2 export version to 4.
Filter nic-50077-eth0-vmware-sfw.2 already has export version 4.
Filter nic-52913-eth0-vmware-sfw.2 already has export version 4.
Filter nic-53498-eth0-vmware-sfw.2 has export version 3, no changes required.
Note: If the export version for any VM vNIC shows up as ‘2’, the script will modify the version to ‘4’ and does not modify other VMs where export version is not ‘2’.
11. Repeat steps 5 – 10 on all hosts in the cluster until completion. This script appears to be necessary as we have seen cases where a VM may still lose its NIC even if it is vmotioned from one NSX vib 6.2.4 host to another 6.2.4 host.
12. Once 6.2.4 host VIB installation is complete, and the script has been run against the hosts and virtual machines running on them, DRS can be set back to your desired setting like Fully automated for instance.
13. Virtual machines should now be able to vmotion between hosts without losing their NICs.
- This process was thoroughly tested in a vCloud Director cloud environment containing over 20,000 virtual machines, and on roughly 240 ESXi hosts without issue. vCenter environment was vCSA version 6u2, and ESXi version 6u2.


You must be logged in to post a comment.