
This blog series assumes that the reader has some understanding of how to create a vRealize Operations Manager (vROps) dashboard.
vROps dashboards are made up of what is called widgets. These widgets can either be configured as “self providers”, or can be populated with data by a “parent” widget. Self provider widgets, are configured to individually show specific data. In other words, one widget shows hosts, another shows datastores, and another showing virtual machines, however the widgets will not interact, nor are they dependent of each other. Parent widgets, are configured to provide data from a specific source, and then feed it into other child widgets on the page. This is useful when data is desired to be displayed in different formats of consumption. The dashboard I configured called “vSphere DRS Cluster Health”, does just that. I will break the widgets down to different sections as I walk through the configuration.
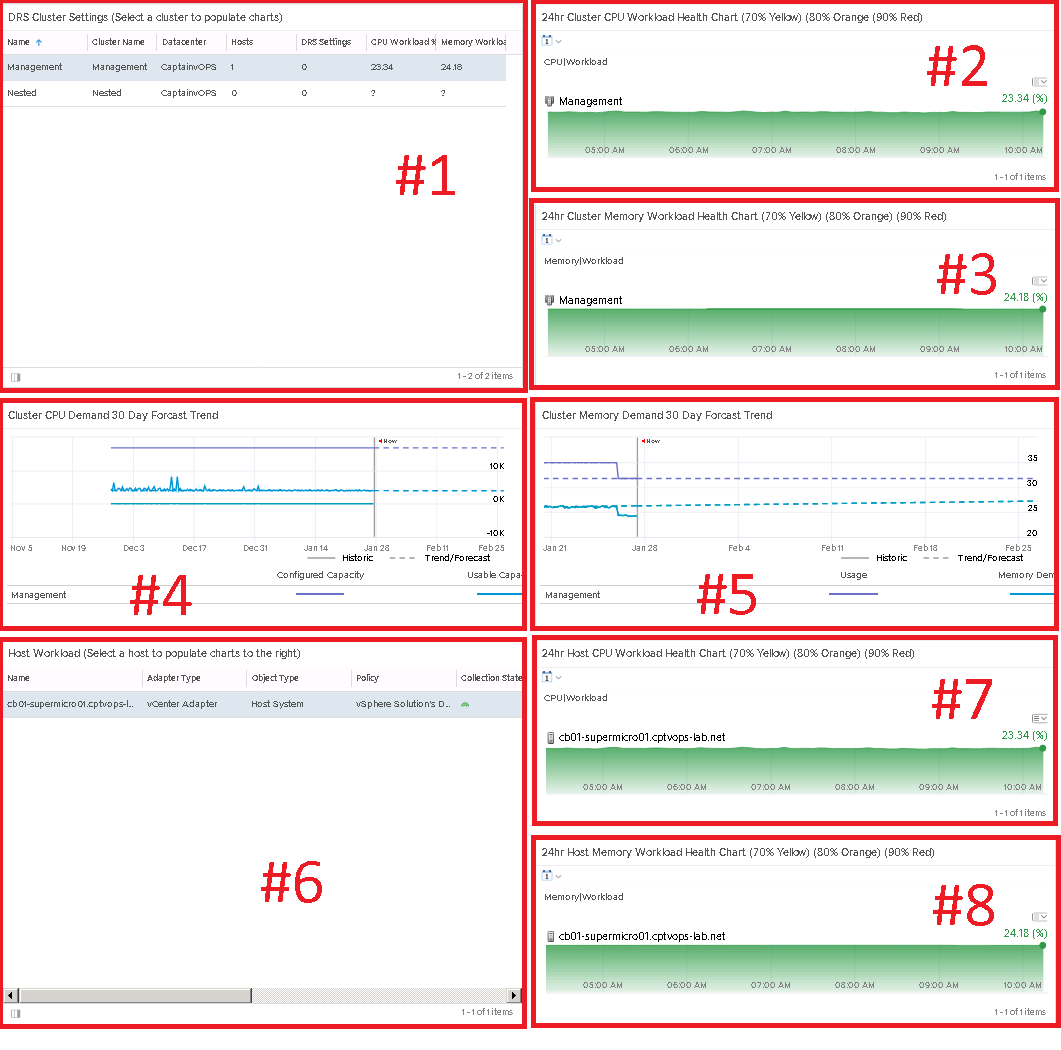
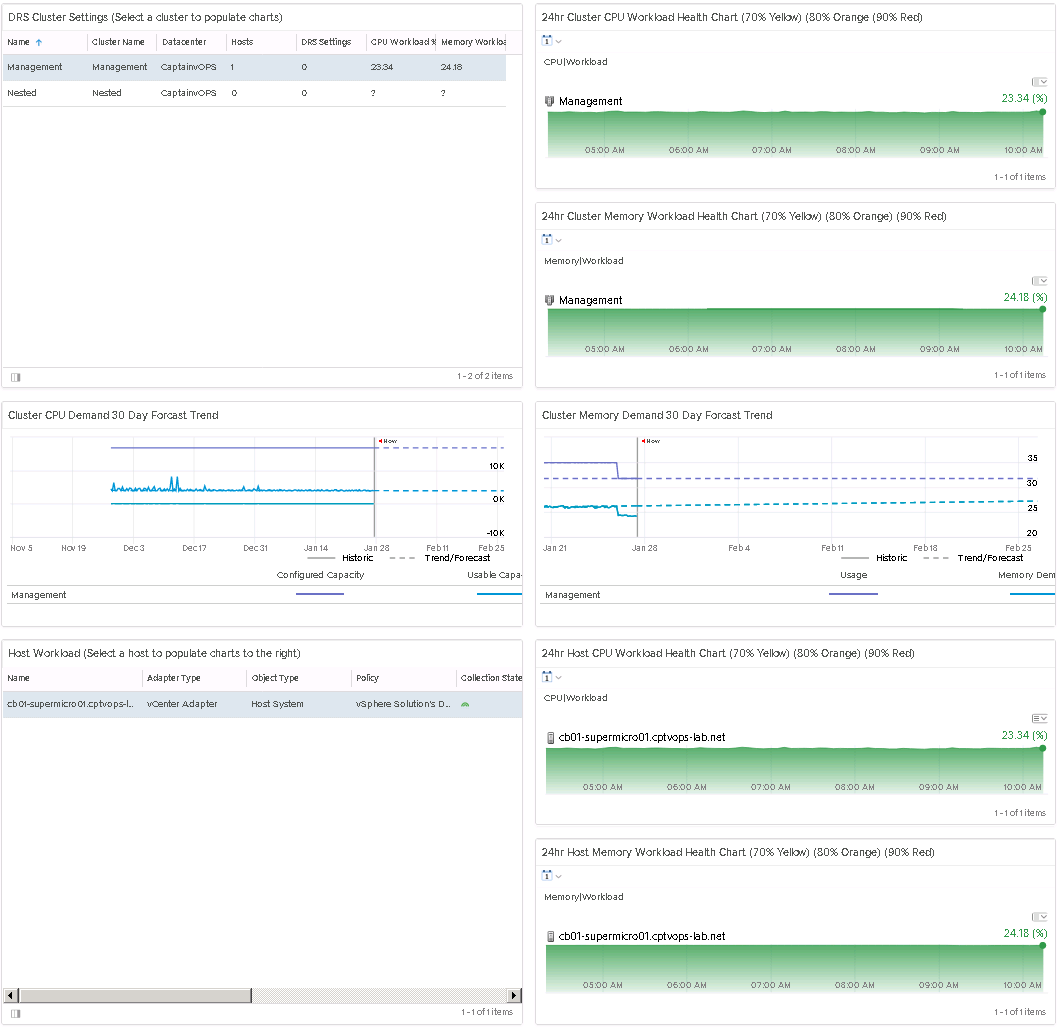
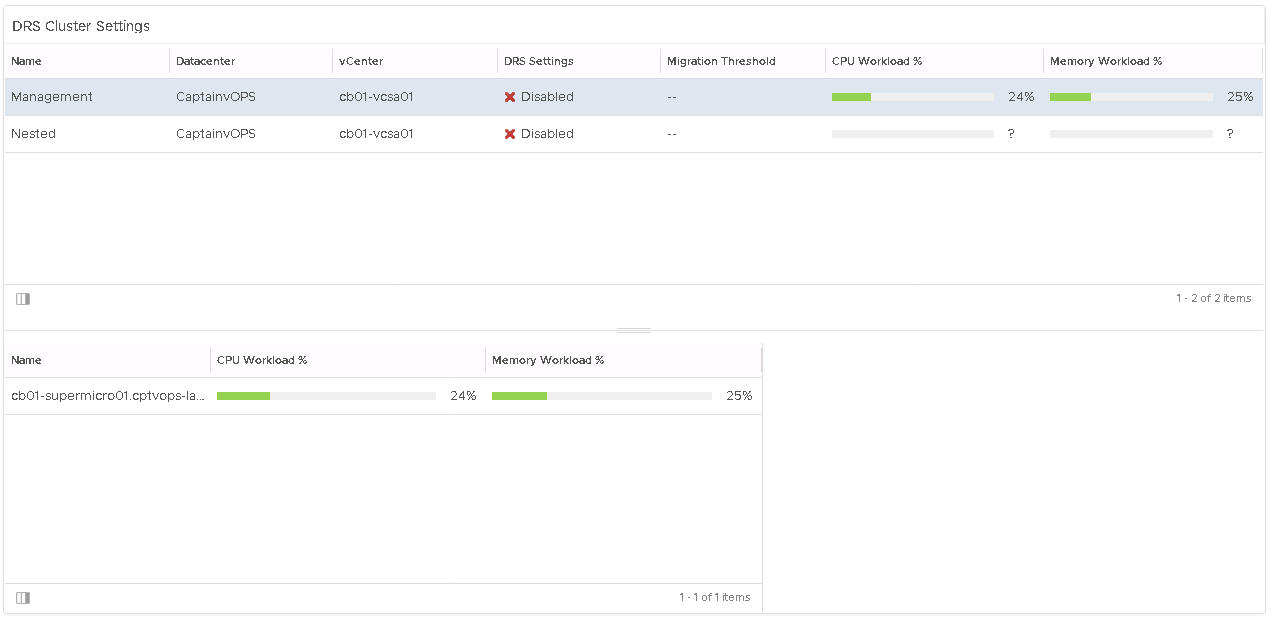
Widget #1 – This widget is known as an “object list“, and will be the parent widget of this dashboard. In other words, widgets #2 through #6 rely on the data presented by widget #1. In this case I have the object list widget, configured to show/list the different host clusters in my homelab.
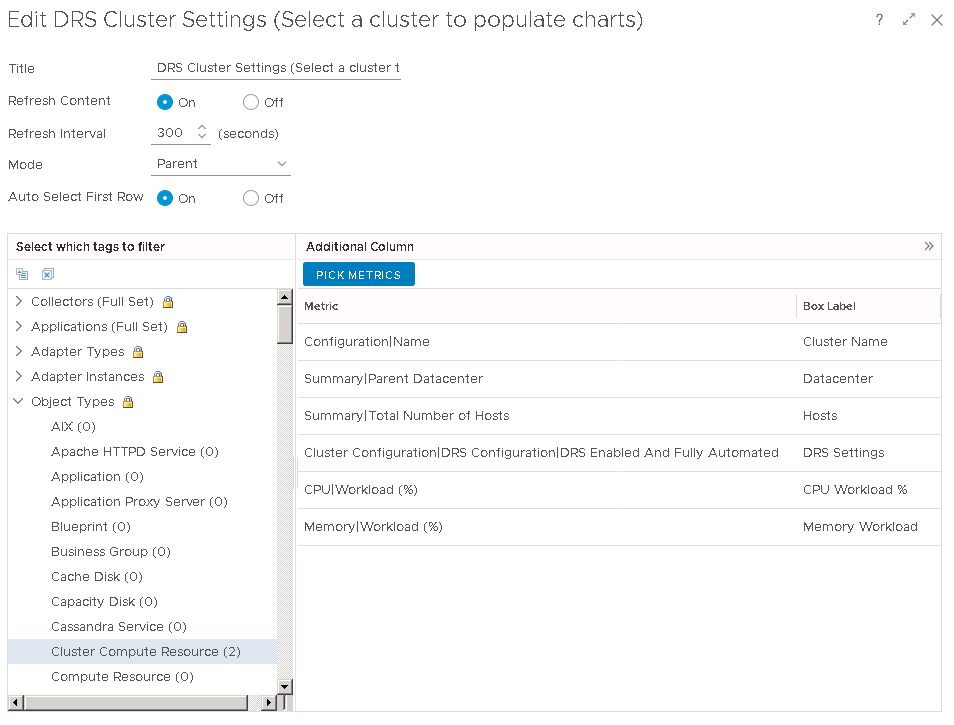
I have given it a title, set refresh content to ON, set the mode to PARENT, and have it set to auto select the first row. In the lower left section “Select which tags to filter”, I have created an environment group in vROps called “Cluster Compute Resource” where I have specified my host clusters. In the lower right box, I have a few metrics selected which I would also like this “object list” widget to show.
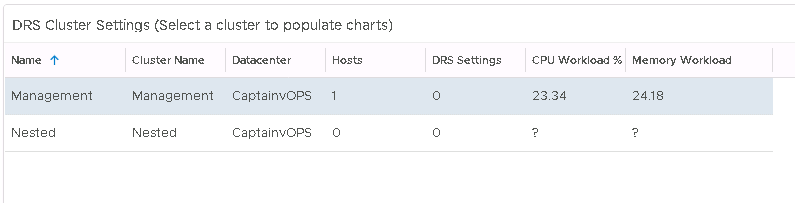
This is just a single esxi homelab, so this won’t look as grand as it would if it were to be configured for a production environment. But each object in this list is select-able, and the cool thing is that each object in this list, when it is selected, will change the other widgets.
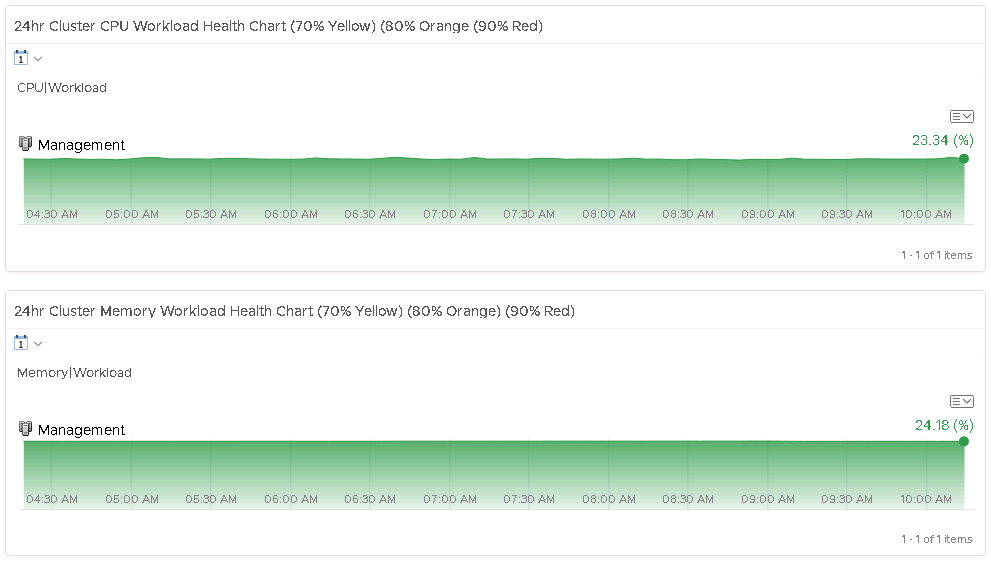
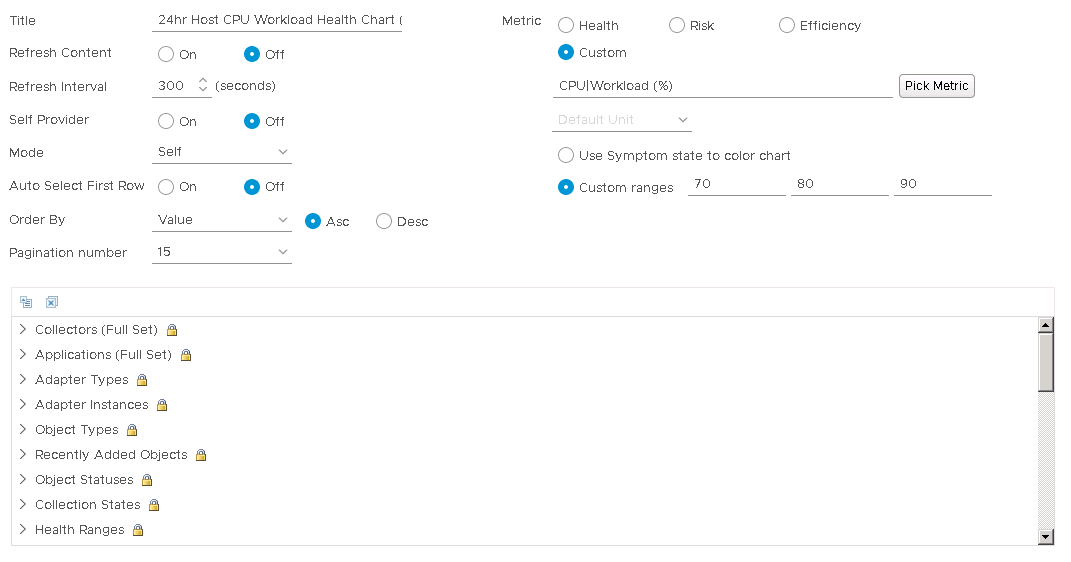
Widgets #2 and #3 are called “health charts”. I have one configured with the metric for cluster CPU workload %, and the other configured with the metric cluster memory workload %. Both configurations are the same, with the exception that one has a custom metric of Cluster CPU Workload %, and the other is configured with the custom metric of Cluster Memory Workload %. I have both configured to show data for the past 24hrs.
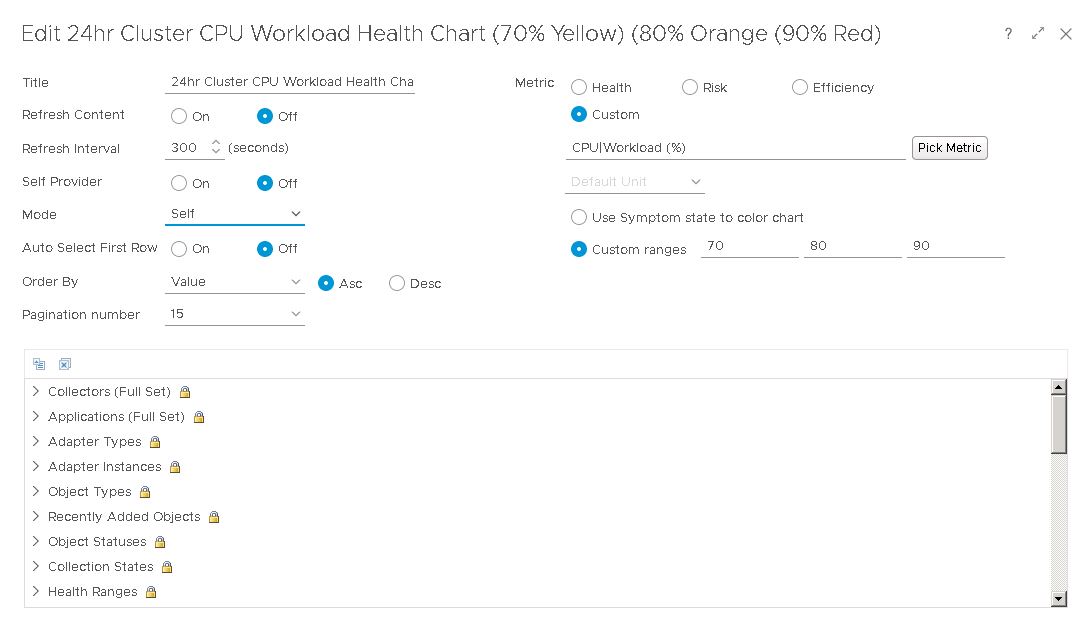
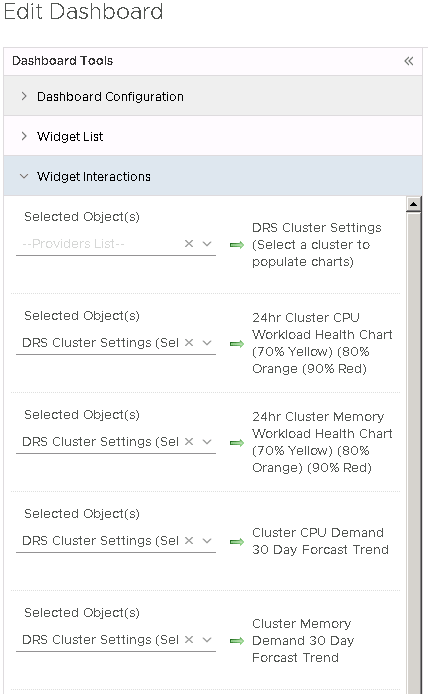
Important: For these two widgets, under “widget interactions“, set both to the first widget: DRS Cluster Settings (Select a cluster to populate charts)
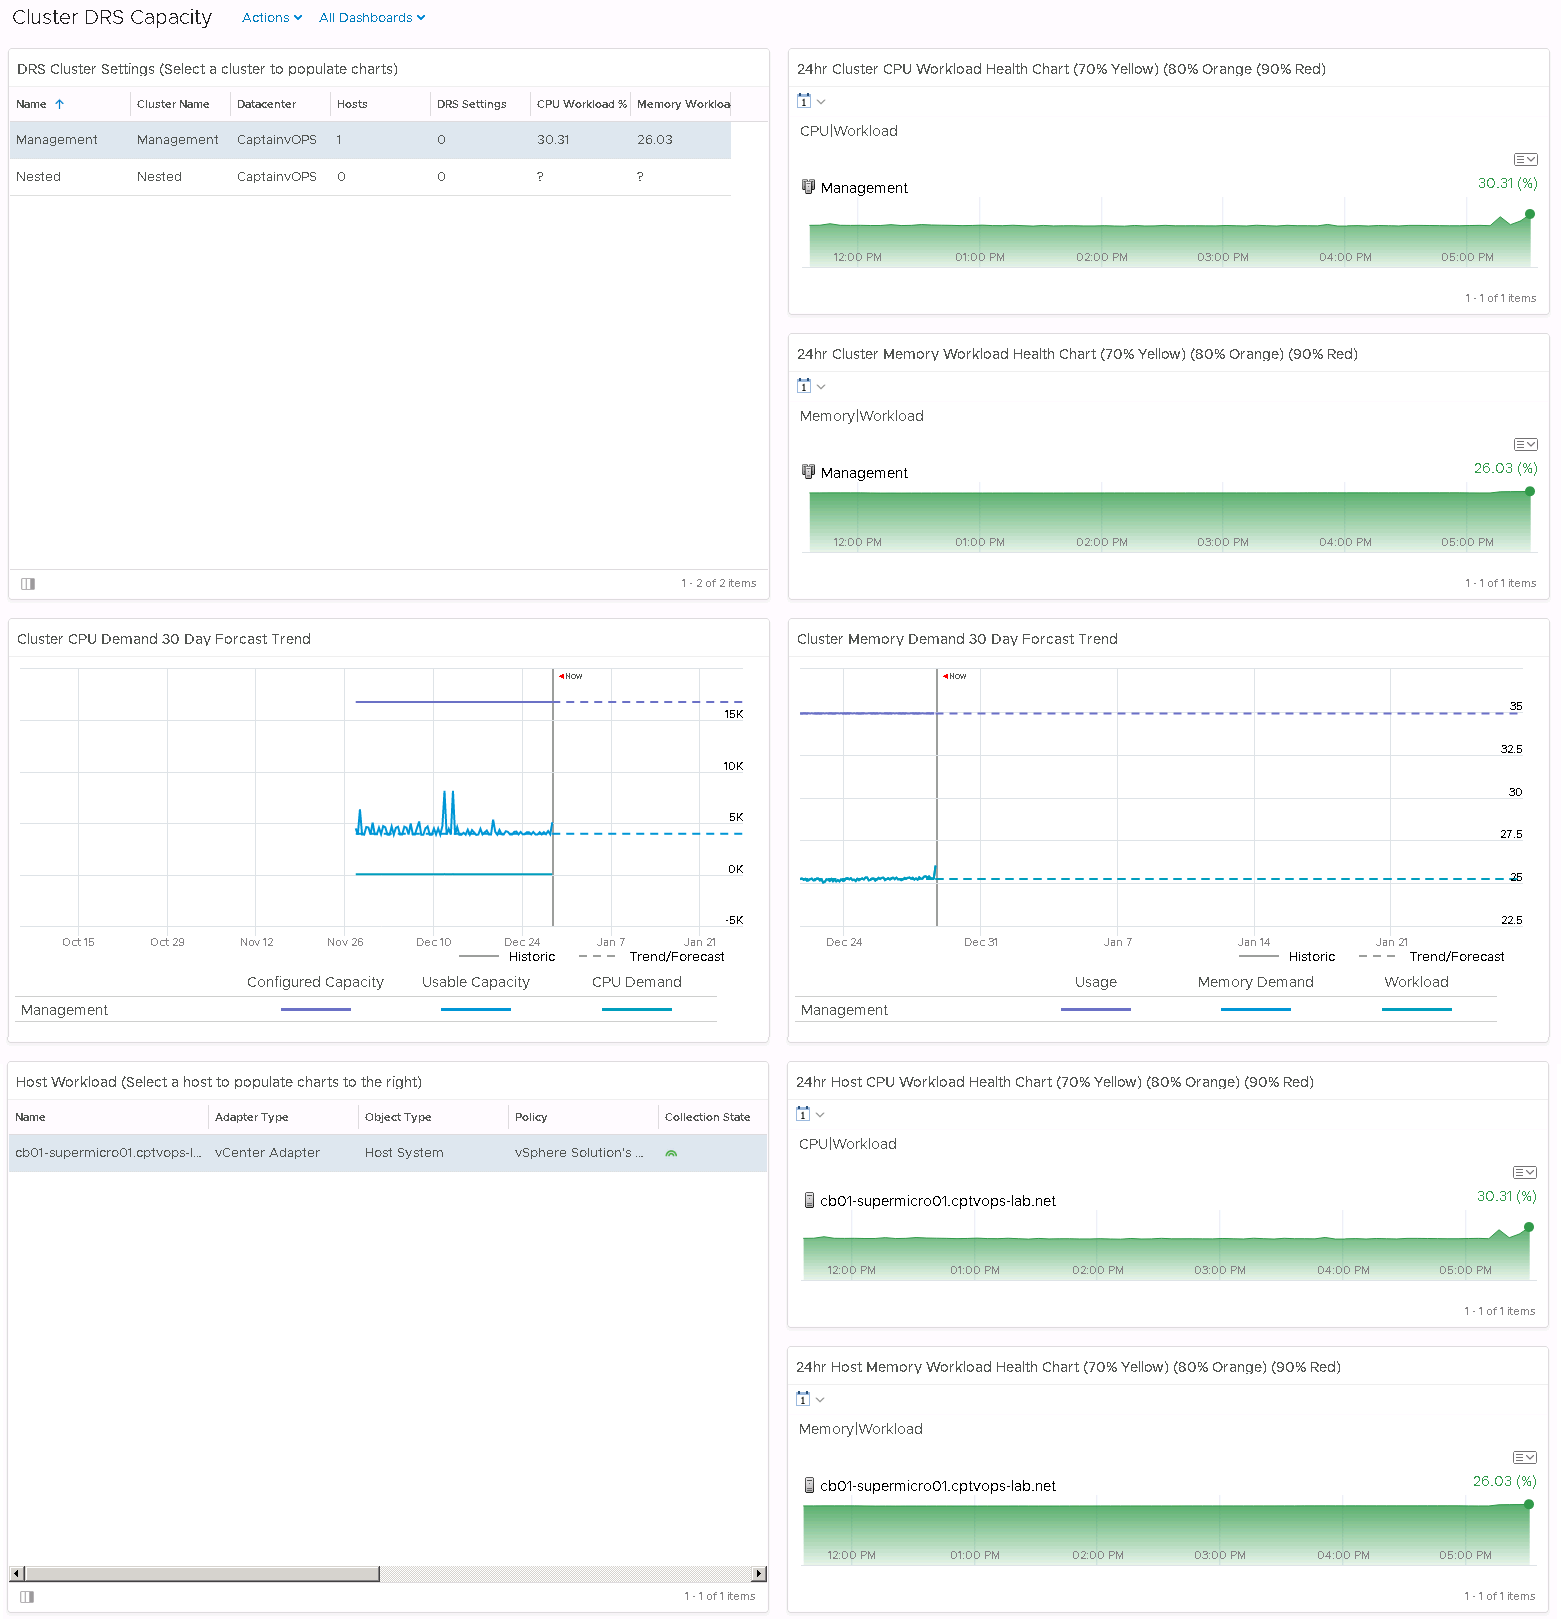
Widgets #4 and #5 are called “View widgets”. One is configured to show the current Cluster CPU Demand, and the other is configured to show the current Cluster Memory Demand. These are also configured to forecast out for 30 days, so that we can potentially see if the clusters will run short of capacity in the near future, allowing us the ability to add more compute to the cluster preemptively.
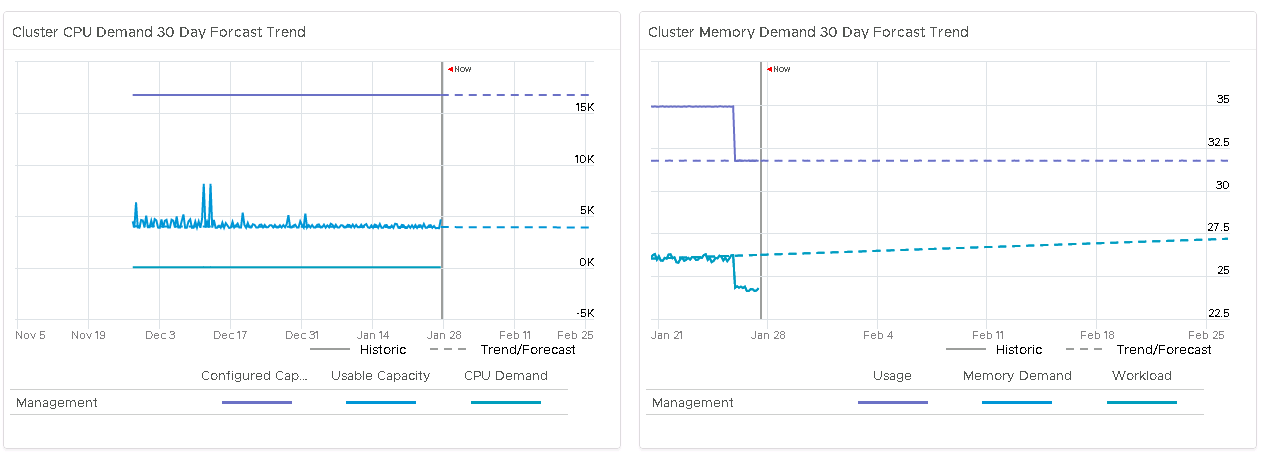
These are two custom “views” I created. I will go over how to create custom views in a future post, but for those who already know how, I have one “widget view” configured with each.
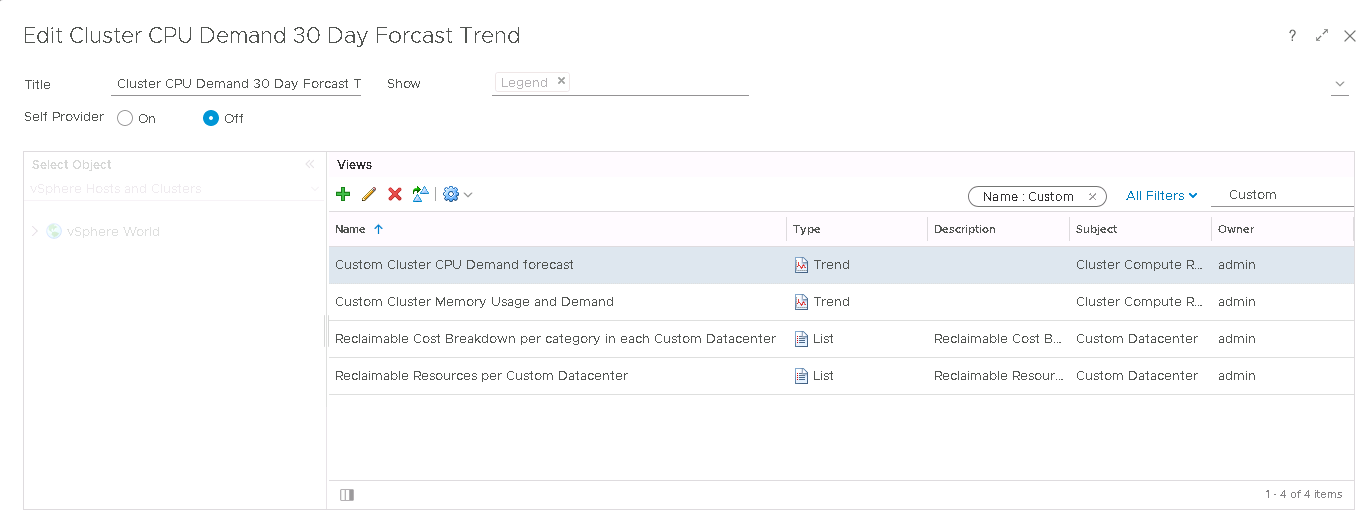
Important: For these two widgets, under “widget interactions“, set both to the first widget: ” DRS Cluster Settings (Select a cluster to populate charts) ” like we did above.
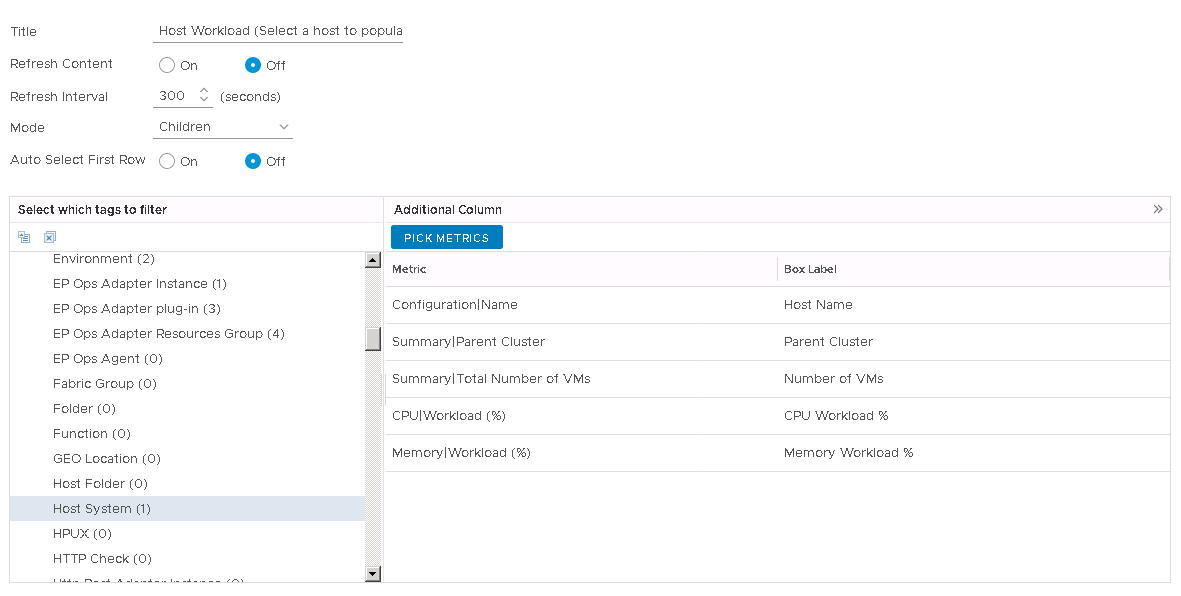
Widget #6 is another “Object List” widget, and I have this configured to show only host systems, of the selected cluster in Widget #1. Widget #6 will be used to provide data to Widgets #7 and #8.
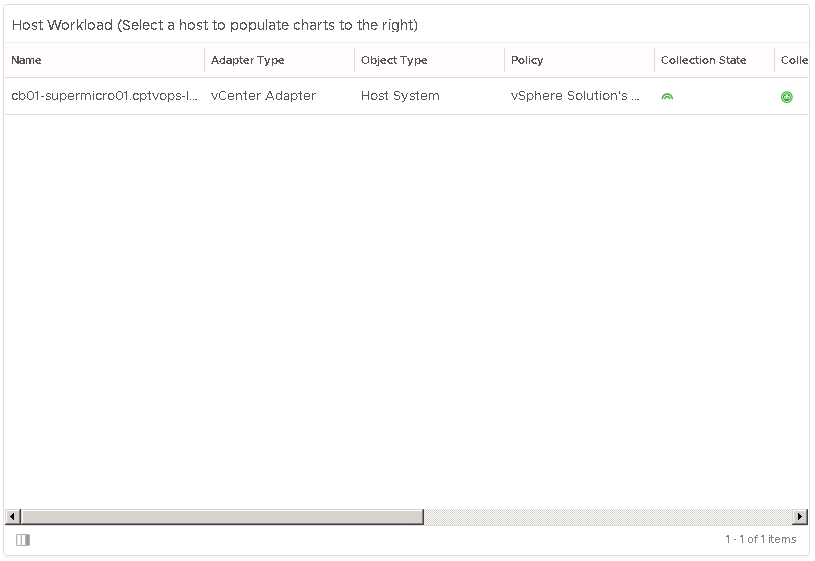
I also have certain Host System metrics selected here so that I can get high level information of the hosts in the cluster.
Important: For these two widgets, under “widget interactions“, set both to the first widget: ” DRS Cluster Settings (Select a cluster to populate charts)” like we did above.
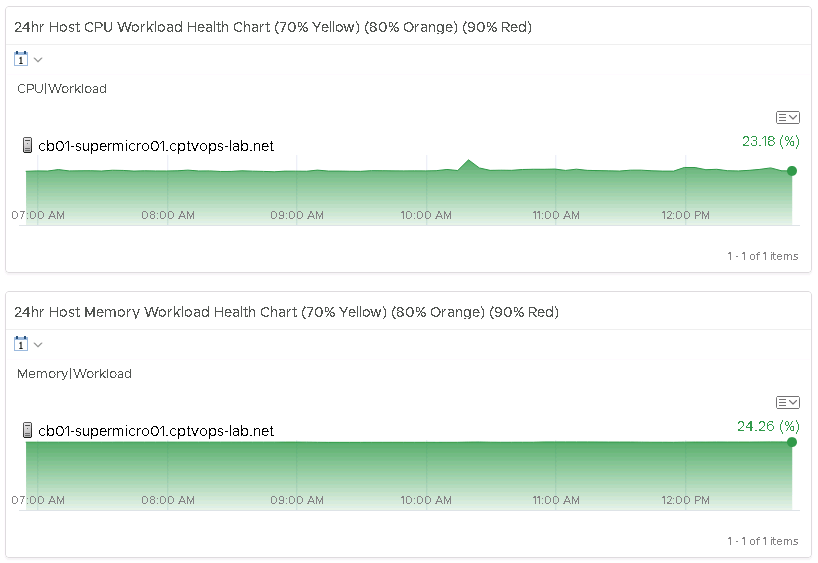
The final two widgets, #7 and #8, are also called “health chart” widgets. One is configured using the metric host system CPU workload %, and the other is configured using the metric host system Memory workload %. I have both configured to show data for the past 24hrs.
Important: For these two widgets, under “widget interactions“, set both to widget #6, in this example: Host Workload (select a host to populate charts to the right).


You must be logged in to post a comment.