
A few weeks ago, I had a customer ask me about creating a custom vROPs dashboard for them, so that they could monitor the health of the clusters. For those of you who were unaware, VMware has packaged vROPs with a widget called “DRS Cluster Settings”, that does something similar, and look like this:
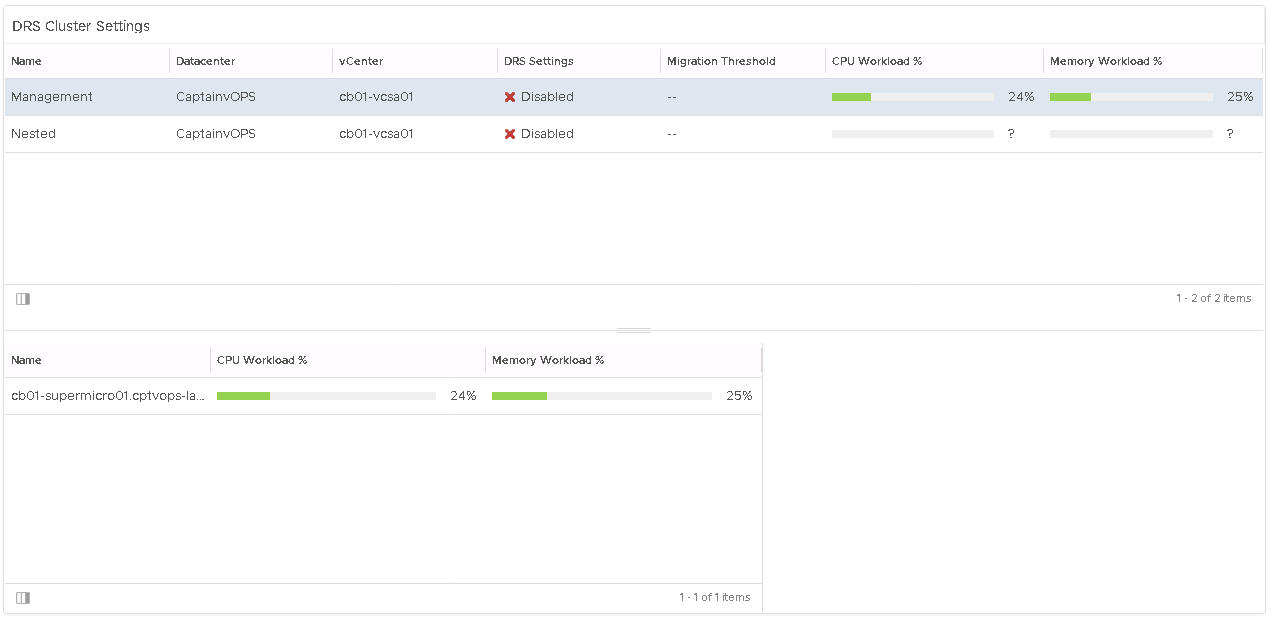
The idea behind this widget, is that it will list all clusters attached to the vCenter, giving you high level information such as the DRS setting, and the memory and CPU workload of the cluster. With a cluster selected, in the lower window you will see all of the ESXi hosts apart of that cluster, with their CPU and memory workloads as well. If you are interested in this widget, it can be added when creating a new custom dashboard, and you will find it at the bottom of the available widget list.
While this widget gave me some high level detail, it wasn’t exactly what I wanted, so I decided to create my own to give a deeper level of detail. I used the widget above as a template, and went from there.
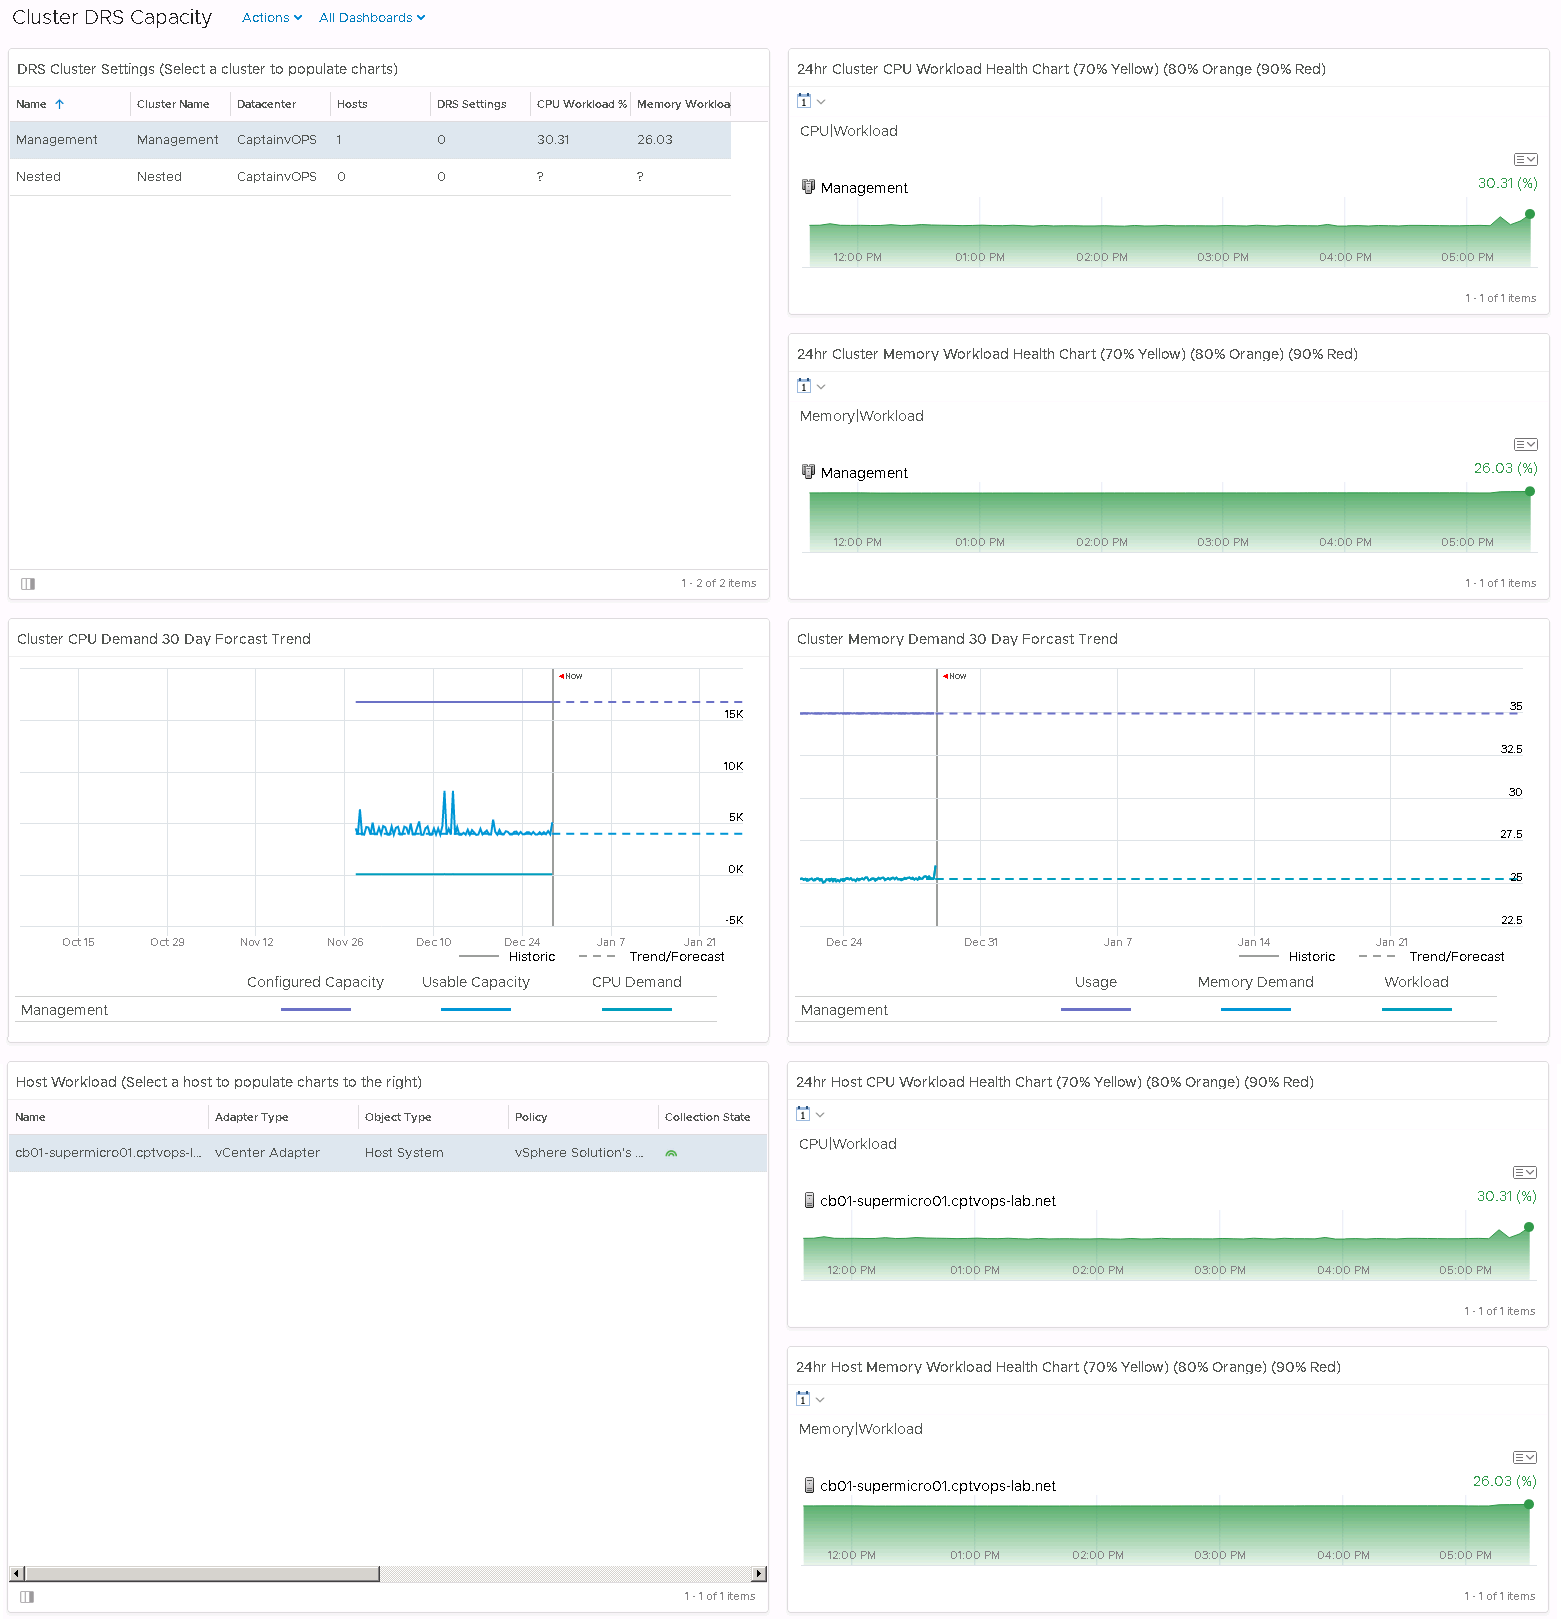
This dashboard gives me the current memory and CPU workloads for each cluster in the upper left box, and once a cluster selected, it populates the right, and two middle boxes with data. The top right boxes gives me the memory and CPU workload for the past 24hrs, and the two middle boxes gives me the CPU demand and memory demand forecasts for the next 30 days.
Much like the widget mentioned above, by selecting a cluster in the upper left side, in the lower left side there is a box that will populate with all hosts attached to that cluster. Once a host is selected, in the lower right box, we also get a memory and CPU workload for the past 24hrs for the selected host. This dashboard is slightly larger than a page will allow, so unfortunately users would need to scroll down to see all of the data, but I believe it gives an outstanding birds-eye view of the clusters DRS capabilities.
In my next blog post, I’ll break down what’s involved in creating this dashboard.

You must be logged in to post a comment.