
Blog Date: 08/23/2024
VMware Cloud Foundation 4.x
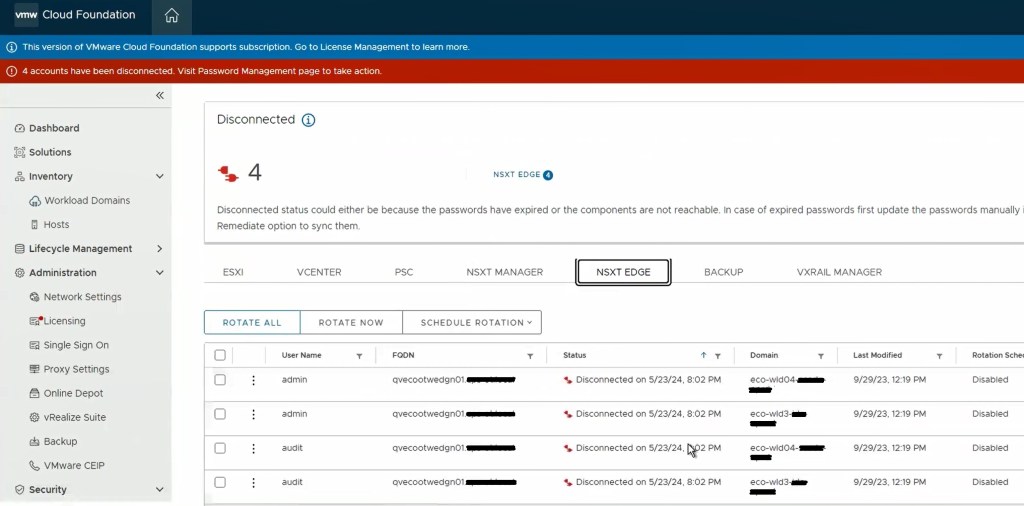
One of the cool features of VMware Cloud Foundation has, is the ability to manage VMware endpoint passwords from SDDC manager i.e.: NSX, edges, vCenter, ESXi hosts, and Aria Suite Lifecycle Manager. I wanted to share an experience I had on a recent VMware Cloud Foundation (VCF) 4.x project, where the NSX-T edge root, admin, and audit accounts expired and showed disconnected in SDDC manager.
I’ve decided to split this blog into two parts, because we ended up having two different issues. The first being that the edges, had been redeployed through NSX-T, and the second being a result of the first, that the known HostKey had changed for the edges.
Although we were able to remediate the root accounts on the edges, we could not remediate the admin and audit accounts.
I went through the process of resetting the root, admin, and audit accounts of the edges to what the SDDC manager had, and made sure to unlock those accounts, all done with the following knowledge base articles:
Credential operations fail on NSX Components in SDDC Manager and NSX-T Edge Nodes Disconnected in Password Manager on SDDC.
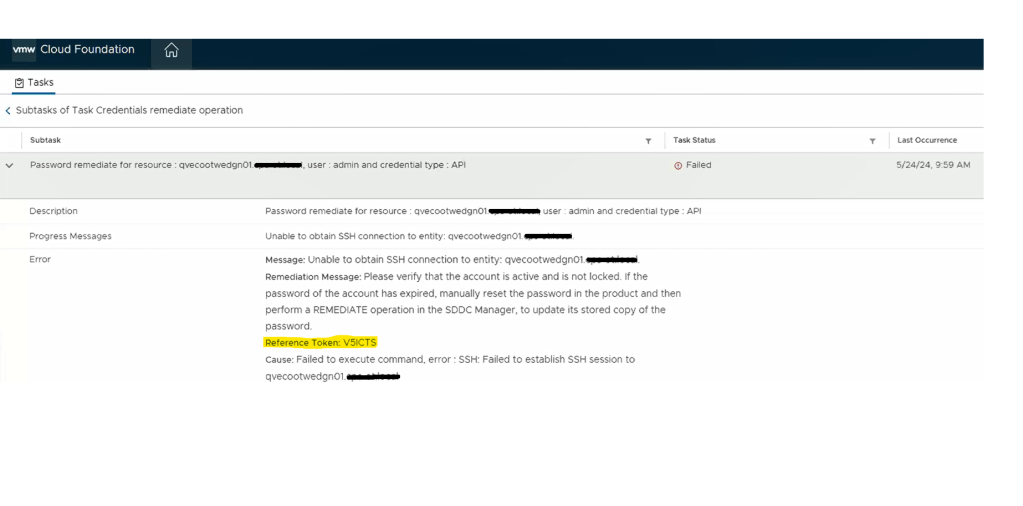
Going back to the SDDC manager, we are now able to remediate and rotate the root account of the NSX-T edges. However, the admin and audit accounts won’t remediate and we see the following error displayed in the SDDC manager UI.
Digging deeper into the problem, we established an SSH session to the SDDC manager to review the operationsmanager.log located in /var/log/vmware/vcf/. We did a “less operationsmanager.log” and searched for the edge, in this example “qvecootwedgen01”. We found that the SSH connection could not be established due to the HostKey being changed.
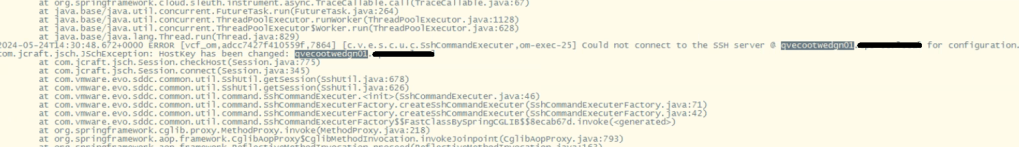
With this error message, we wanted to validate the edge IDs in the SDDC manager database, and compare those to the ones in the NSX-T manager, suspecting the edge IDs had changed likely to being redeployed directly through the NSX-T manager instead of the SDDC manager.
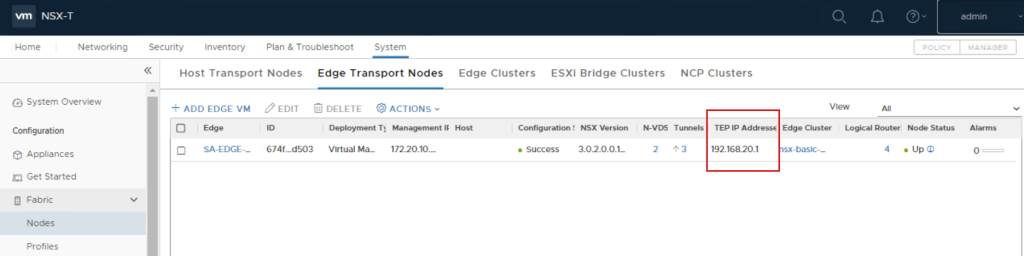
Looking in the NSX-T manager UI, we can get the edge node ID.
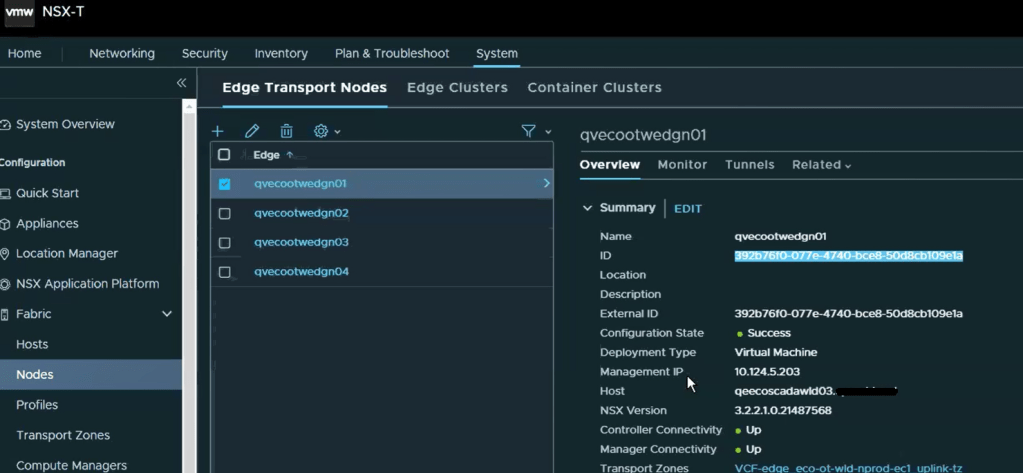
Copy the edge ID to a text file. Let’s compare that to what the SDDC manager has. SSH to the SDDC manager, and su root.
Run the following curl command to gather and output the NSX-T edge clusters to a json for review.
curl http://<VCF_hostname>/inventory/nsxt-edgeclusters | json_pp >> /tmp/cluster.jsonYou should seem similar output to:

Now, let’s check the json output to compare the edge node ID. change directory to the tmp directory and do a less on the cluster.json.
less cluster.json
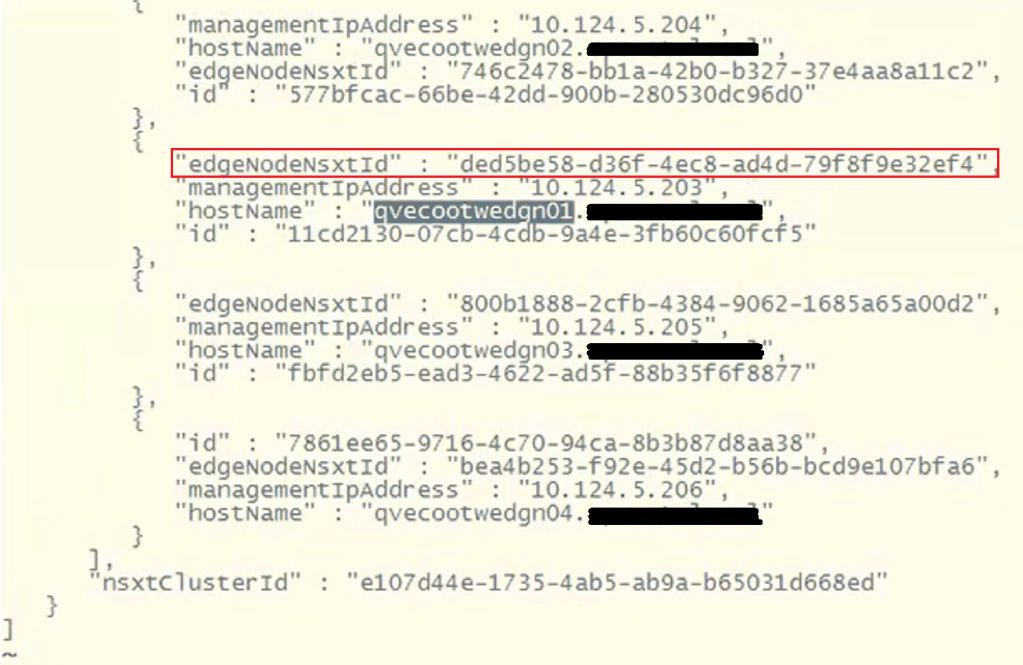
To find the edge node we are looking for, do a /<edgenode> and hit enter. For this example, we are looking for edge “qvecootwedge01”.
Looking at the “edgeNodeNsxtId” of the example edge qvecootwedge01, we can see the ID does not match what was found in NSX-T UI, which would be an indication the edge had been updated/redeployed at some point. This is one of the reasons why the edge shows disconnected in SDDC manager UI, and it needs to be corrected.
At this point, there’s enough evidence to contact support. However, after having been through this in VCF 4.x deployments, I have detailed steps here in this blog and the next, that I have used to resolve this issue. For those willing…. Grab a partner; we’ll be doing open heart surgery on the SDDC manager database…
**************************************************************************************************************
STOP… Before continuing, take an *offline* (powered off) snapshot of the SDDC manager VM as we will be updating the edgenode ID (edgenodeNsxtId) in the SDDC manager database.
**************************************************************************************************************
Disclaimer: While this process has worked for me in different customer environments, not all environments are the same, and your mileage may vary.
It’s important to note that we will not be interacting with the NSX-T edge node, and we are only updating the SDDC manager database. There’s no impact to the edge node traffic. There is always an associated risk with updating the SDDC manager database, which is the reason for the snapshot. We can always revert back to the snapshot and undo the change if needed.
Change to the tmp directory if not already there.
With the next command, we’ll be cloning the nsxt-edgecluster config into a cluster.json for us to modify for the purpose of updating the edgenodeNsxtId value of the edge, to match the ID that was in the NSX-T manager. Modify the following command and update with the FQDN of the SDDC appliance:
curl http://<VCF_hostname>/inventory/nsxt-edgeclusters | json_pp >> /tmp/cluster.jsonExample output:

Now that we have a current export of the config, we’ll clone the config.json to a new file we will edit.
cp cluster.json cluster_fixed.jsonLet’s edit the new cluster_fixed.json.
vi cluster_fixed.jsonThe contents of this json contain all of the NSX-T edge clusters for the particular NSX-T cluster. This may have more edge clusters or less depending on the deployment model chosen for VCF. Page Down until you find the desired edge cluster that needs to be updated.
Next, we’ll need to delete everything else in the json and only keep the desired edge cluster that needs to be updated, because we will eventually pass this json back to the SDDC manager, and this is the only way it will accept the updated edge IDs for the edges that are part of this cluster.
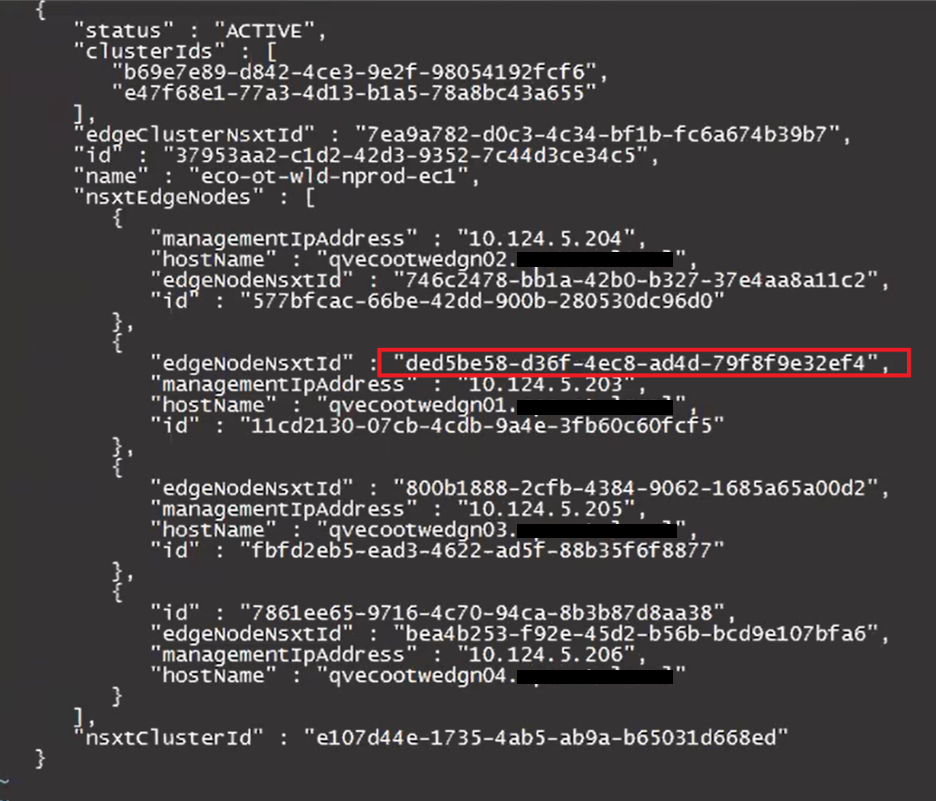
In this example, we are only keeping the config for the edge cluster “eco-ot-wld-nprod-ec1”. There will be a ‘ ] ‘ at the end of the json that will need to be deleted. The resulting json should look something like this.

Update the desired “edgeNodeNsxtId”(s) with the desired ID(s) we got from the NSXT UI earlier.
Before:
After:
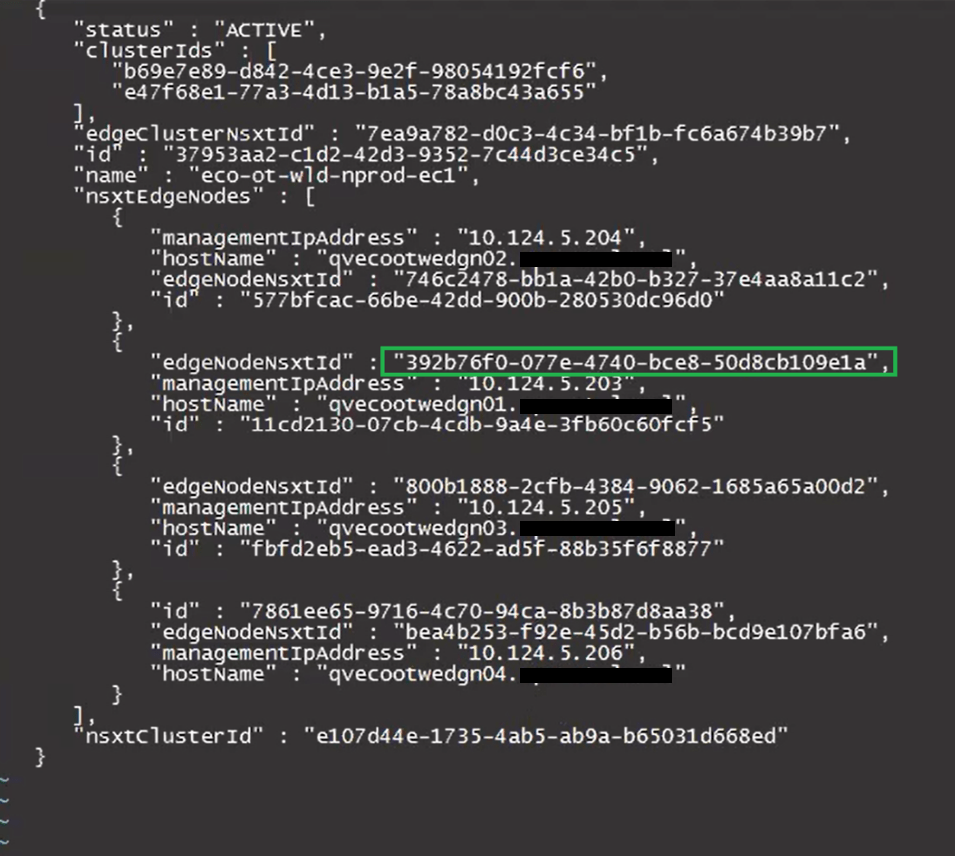
Keep the new edge ID handy, as we will need it for the curl command later on when we pass the updated cluster_fixed.json back to the SDDC manager.
Press ‘esc’. Enter ‘:wq’ to save the cluster_fixed.json.
Modify this curl command to update the SDDC manager host name where it says localhost, update the json name to replace test.json, and place the ID for the nsxT edge cluster at the end after the ‘/’.
curl -X PUT -H "Content-Type: application/json" --data @test.json http://localhost/inventory/nsxt-edgeclusters/The updated curl command should look something like this example:
curl -X PUT -H "Content-Type: application/json" --data @cluster_fixed.json http://pvecootvcf01/inventory/nsxt-edgeclusters/37953aa2-c1d2-42d3-9352-7c44d3ce34c5Paste the command into the terminal and hit enter to run. The output should be similar to this example:

You may need to repeat this process for additional edge IDs that need to be updated.
Now that the edge node ID(s) have been updated, we will need to Run something called the fix_known_hosts.sh script, that will update the HostKeys of the edges on the SDDC manager, so that it will successfully be able to connect. I cover this process in part 2 of this blog –> VMware Cloud Foundation SDDC Manager Unable To Remediate Edge Admin and Audit Passwords. Part 2.


You must be logged in to post a comment.