vRealize Operations Manager Dashboard: vSphere DRS Cluster Health. Part 2

This blog series assumes that the reader has some understanding of how to create a vRealize Operations Manager (vROps) dashboard.

vROps dashboards are made up of what is called widgets. These widgets can either be configured as “self providers”, or can be populated with data by a “parent” widget. Self provider widgets, are configured to individually show specific data. In other words, one widget shows hosts, another shows datastores, and another showing virtual machines, however the widgets will not interact, nor are they dependent of each other. Parent widgets, are configured to provide data from a specific source, and then feed it into other child widgets on the page. This is useful when data is desired to be displayed in different formats of consumption. The dashboard I configured called “vSphere DRS Cluster Health”, does just that. I will break the widgets down to different sections as I walk through the configuration.

Widget #1 – This widget is known as an “object list“, and will be the parent widget of this dashboard. In other words, widgets #2 through #6 rely on the data presented by widget #1. In this case I have the object list widget, configured to show/list the different host clusters in my homelab.

I have given it a title, set refresh content to ON, set the mode to PARENT, and have it set to auto select the first row. In the lower left section “Select which tags to filter”, I have created an environment group in vROps called “Cluster Compute Resource” where I have specified my host clusters. In the lower right box, I have a few metrics selected which I would also like this “object list” widget to show.

This is just a single esxi homelab, so this won’t look as grand as it would if it were to be configured for a production environment. But each object in this list is select-able, and the cool thing is that each object in this list, when it is selected, will change the other widgets.

Widgets #2 and #3 are called “health charts”. I have one configured with the metric for cluster CPU workload %, and the other configured with the metric cluster memory workload %. Both configurations are the same, with the exception that one has a custom metric of Cluster CPU Workload %, and the other is configured with the custom metric of Cluster Memory Workload %. I have both configured to show data for the past 24hrs.

Important: For these two widgets, under “widget interactions“, set both to the first widget: DRS Cluster Settings (Select a cluster to populate charts)

Widgets #4 and #5 are called “View widgets”. One is configured to show the current Cluster CPU Demand, and the other is configured to show the current Cluster Memory Demand. These are also configured to forecast out for 30 days, so that we can potentially see if the clusters will run short of capacity in the near future, allowing us the ability to add more compute to the cluster preemptively.

These are two custom “views” I created. I will go over how to create custom views in a future post, but for those who already know how, I have one “widget view” configured with each.

Important: For these two widgets, under “widget interactions“, set both to the first widget: ” DRS Cluster Settings (Select a cluster to populate charts) ” like we did above.

Widget #6 is another “Object List” widget, and I have this configured to show only host systems, of the selected cluster in Widget #1. Widget #6 will be used to provide data to Widgets #7 and #8.

I also have certain Host System metrics selected here so that I can get high level information of the hosts in the cluster.

Important: For these two widgets, under “widget interactions“, set both to the first widget: ” DRS Cluster Settings (Select a cluster to populate charts)” like we did above.

The final two widgets, #7 and #8, are also called “health chart” widgets. One is configured using the metric host system CPU workload %, and the other is configured using the metric host system Memory workload %. I have both configured to show data for the past 24hrs.

Important: For these two widgets, under “widget interactions“, set both to widget #6, in this example: Host Workload (select a host to populate charts to the right).

Add Custom Recommendation to vROps alert definition for versions prior to 6.6

  • This is useful when a new SOP document is created, we will be able to link to it directly on the alert email that is sent.

Step-By-Step

  1. Log into the main vRealize Operations Manager page.
  2. Click Content and then Recommendations

  3. On this page you can create, edit and delete custom recommendations.  Click the green plus sign to create a new custom recommendation.
  4. Here you can enter the test for the custom recommendation.  Paste the link to the SOP, highlight it, and then click the hyperlink icon.  Now paste the link again and click OK.  The “actions” section will allow the use of automated functions if you were looking at the triggered alert in vROps.  For now, just click save.
  5. Now you can add the custom recommendation to an alert definition.  Click Content and then Alert Definitions.
  6. Search for the alert that you would like to add the SOP to, select it and click the edit button.
  7. Click on section 5: Add Recommendations and then click on the plus sign
  8. Now you will need to search for the new SOP recommendation you just created, so search for SOP, find it in the list on the left, click and drag to position under the Recommendations section.
  9. Finally click save.  Now when this alert is triggered, and an email is sent, there will be a clickable link in the email to the SOP document.

Performing A Database Health Check On vRealize Operation Manager (vROPS) 6.5

In a previous post I showed how you could perform a healthcheck, and possibly resolve database load issues in vROPs versions from 6.3 and older. When VMware released the vROPS 6.5, they changed the way you would access the nodetool utility that is available with cassandra database.

 $VCOPS_BASE/cassandra/apache-cassandra-2.1.8/bin/nodetool --port 9008 status

For the 6.5 release and newer, they added the requirement of using a ‘maintenanceAdmin’ user along with a password file.  The new command to check the load status of the activity tables in a vROPS 6.5+ is as follows:

  $VCOPS_BASE/cassandra/apache-cassandra-2.1.8/bin/nodetool -p 9008 --ssl -u maintenanceAdmin --password-file /usr/lib/vmware-vcops/user/conf/jmxremote.password status

Example output would be something similar to this if your cluster is in a healthy state:

vrops51

If any of the nodes have over 600 MB of load, you should consult with VMware GSS or a TAM on the next steps to take, and how to elevate the load issues.

Next we can check the syncing status of the cluster to determine overall health.  The command is as follows:

$VMWARE_PYTHON_BIN /usr/lib/vmware-vcops/tools/vrops-platform-cli/vrops-platform-cli.py getShardStateMappingInfo

Example output:

vrops52

The “vRealize Ops Shard” refers to the data nodes, and the Master and Master Replica nodes in the main cluster. The available status’ are RUNNING, SYNCING, BALANCING, OUT_OF_BALANCE, and OUT_OF_SYNC.

  • Out of Balance and Out of Sync should be enough to open an SR and have VMware take a look.

Lastly, we can take a look at the size of the activity table.  You can do this by running the following command:

 du -sh /storage/db/vcops/cassandra/data/globalpersistence/activity_tbl-*

Example Output:

vrops53

If there are two listed here, you should consult with VMware GSS as to which one can safely be removed, as one would be left over from a previous upgrade.


Removing Old vROps Adapter Certificates

I’ve come across this issue in previous versions of vRealize Operations Manager prior to the 6.5 release, where you delete an adapter for data collection like vSphere, NSX or VCD, and immediately try to re-create it.  Whether it was a timing issue, or vROps just didn’t successfully complete the deletion process, I’d typically get an error that the new adapter instance could not be created because a previous one exists with the same name.  Now there are two ways around this.  You can connect the adapter to whatever instance (VCD, NSX, vSphere) you are trying to collect data from using the IP address, instead of the FQDN (or vice-versa), or you can cleanup the certificate that was left behind manually as I will outline the steps below.

To resolve the issue, delete the existing certificate from Cassandra DB and accept the new certificate re-creating adapter instance.

1. Take snapshots of the cluster

2.  SSH to the master node.  Access the Cassandra DB by running the following command:

 $VMWARE_PYTHON_BIN $VCOPS_BASE/cassandra/apache-cassandra-2.1.8/bin/cqlsh --ssl --cqlshrc $VCOPS_BASE/user/conf/cassandra/cqlshrc

3. Access the database by running the following command:

use globalpersistence;

4.  We will need to look at the entries in the global persistence certificate store.  To do this, first list all the entries in globalpersistence.certificate store by running the following command:

SELECT * from globalpersistence.certificate;

5. From the list, find the desired certificate.  Now select that specific certificate with the following command:

 SELECT * from globalpersistence.certificate where key = 'Certificate.<ThumbprintOfVCCert>' and classtype = 'certificate' ALLOW FILTERING;

For example:

 SELECT * from globalpersistence.certificate where key = 'Certificate.e88b13c9e346633f94e46d2a74182d219a3c98b2' and classtype = 'certificate' ALLOW FILTERING;

6.   The tables which contains the information:

namespace | classtype | key | blobvalue | strvalue | valuetype | version
——————-+—————+——-+—————–+————–+—————–+———

7.  Select the Key which matches the Thumbprint of the Certificate you wish to remove and run the following command:

 DELETE FROM globalpersistence.certificate where key = 'Certificate.<ThumbprintOfVCCert>' and classtype = 'certificate' and namespace = 'certificate';

For example:

 DELETE FROM globalpersistence.certificate where key = 'Certificate.e88b13c9e346633f94e46d2a74182d219a3c98b2' and classtype = 'certificate' and namespace = 'certificate';

8.  Verify that the Certificate has been removed from the VMware vRealize Operations Manager UI by navigating to:

Administration > Certificates

9.  Click the Gear icon on the vSphere Solution to Configure.

10.  Click the icon to create an new instance. Do not remove the existing instance unless the data can be lost.  If the old instance has already been deleted prior to this operation, then this warning can be ignored.

11.  Click Test Connection and the new certificate will be imported.

12.   Upon clicking Save there will be an error stating the Resource Key already exists. Ignore this and click Close and the UI will show Discard Changes?. Click Yes.

13.   Upon clicking Certificates Tab the Certificate is shown for an existing VC Instance.  Now you should have a new adapter configured and collecting.  If you kept the old adapter for the data, it can safely be removed after the data retention period has expired.

Shutdown and Startup Sequence for a vRealize Operations Manager Cluster

You ever hear the phrase “first one in, last one out”?  That is the methodology you should use when the need arises to shutdown or startup a vRealize Operations Manager (vROps) cluster.  The vROps master should always be the last node to be brought offline in vCenter, and the first node VM to be started in vCenter.

The proper shutdown sequence is as follows:

  • FIRST: The data nodes
  • SECOND: The master replica
  • LAST: The master

The remote collectors can be brought down at any time.  When shutting down the cluster, it is important to “bring the cluster offline”.  Thing of this as a graceful shutdown of all the services in a controlled manor.  You do this from the appliance admin page

1. Log into the admin ui…. https://<vrops-master>/admin/

vrops48

2. Once logged into the admin UI, click the “Take Offline” button at the top.  This will start the graceful shutdown of services running in the cluster.  Depending on the cluster size, this can take some time.

vrops49

3. Once the cluster reads offline, log into the vCenter where the cluster resides and begin shutting down the nodes, starting with the datanodes, master replica, and lastly the master.  The remote collectors can be shutdown at any time.

4. When ready, open a VM console to the master VM and power it on.  Watch the master power up until it reaches the following splash page example.  It may take some time, and SUSE may be running a disk check on the VM.  Don’t touch it if it is, just go get a coffee as this may take an hour to complete.

The proper startup sequence is as follows:

  • FIRST: The master
  • SECOND: The master replica
  • LAST: The data nodes, remote collectors

vrops4

5. Power on the master replica, and again wait for it to fully boot-up to the splash page example above.  Then you can power on all remaining data nodes altogether.

6. Log into the admin ui…. https://<vrops-master>/admin/

7. Once logged in, all the nodes should have a status of offline and in a state of Not running before proceeding.  If there are nodes with a status of not available, the node has not fully booted up.

vrops50

8. Once all nodes are in the preferred state, bring the cluster online through the admin UI.

Alternatively…..

If there was a need to shutdown the cluster from the back-end using the same sequence, but you should always use the Admin UI when possible:

Proper shutdown:

  • FIRST: The data nodes
  • SECOND: The master replica
  • LAST: The master

You would need to perform the following command to bring the slice offline.  Each node is considered to be a slice.  You would do this on each node.

# service vmware-vcops-web stop; service vmware-vcops-watchdog stop; service vmware-vcops stop; service vmware-casa stop
$VMWARE_PYTHON_BIN /usr/lib/vmware-vcopssuite/utilities/sliceConfiguration/bin/vcopsConfigureRoles.py --action=bringSliceOffline --offlineReason=troubleshooting

If there was a need to startup the cluster from the back-end using the same sequence, but you should always use the Admin UI when possible:

Proper startup:

  • FIRST: The master
  • SECOND: The master replica
  • LAST: The data nodes, remote collectors

You would need to perform the following command to bring the slice online.  Each node is considered to be a slice.  You would do this on each node.

# $VMWARE_PYTHON_BIN $VCOPS_BASE/../vmware-vcopssuite/utilities/sliceConfiguration/bin/vcopsConfigureRoles.py --action bringSliceOnline
# service vmware-vcops-web start; service vmware-vcops-watchdog start; service vmware-vcops start; service vmware-casa start

If there is a need to check the status of the running services on vROps nodes, the following command can be used.

# service vmware-vcops-web status; service vmware-vcops-watchdog status; service vmware-vcops status; service vmware-casa status

Failure Adding an Additional Node to vRealize Operations Manager Due to Expired Certificate

The Issue:

Unable to add additional nodes to cluster.  This error happened while adding an additional data and remote collector.  The cause ended up being a expired customer certificate, and surprisingly there was no noticeable mechanism such as a yellow warning banner in vROps UI to warn that a certificate had expired, or is about to expire.

Troubleshooting:

Log into the the new node being added, and tail the vcopsConfigureRoles.log

# tail -f /storage/vcops/log/vcopsConfigureRoles.log

You would see entries similar to:

2016-08-10 00:11:56,254 [22575] - root - WARNING - vc_ops_utilities - runHttpRequest - Open URL: 'https://localhost/casa/deployment/cluster/join?admin=172.22.3.14' returned reason: 
[SSL: CERTIFICATE_VERIFY_FAILED] certificate verify failed (_ssl.c:581), exception: 
2016-08-10 00:11:56,254 [22575] - root - DEBUG - vcopsConfigureRoles - joinSliceToCasaCluster - Add slice to CaSA cluster response code: 9000
2016-08-10 00:11:56,254 [22575] - root - DEBUG - vcopsConfigureRoles - joinSliceToCasaCluster - Expected response code not found. Sleep and retry. 0 
2016-08-10 00:12:01,259 [22575] - root - INFO - vcopsConfigureRoles - joinSliceToCasaCluster - Add Cluster to slice response code: 9000 
2016-08-10 00:12:01,259 [22575] - root - INFO - vc_ops_logging - logInfo - Remove lock file: /usr/lib/vmware-vcopssuite/utilities/sliceConfiguration/conf/vcops-configureRoles.lck
2016-08-10 00:12:01,259 [22575] - root - DEBUG - vcopsPlatformCommon - programExit - Role State File to Update: '/usr/lib/vmware-vcopssuite/utilities/sliceConfiguration/data/roleState.properties'
2016-08-10 00:12:01,260 [22575] - root - DEBUG - vcopsPlatformCommon - UpdateDictionaryValue - Update section: "generalSettings" key: "failureDetected" with value: "true" file: "/usr/lib/vmware-vcopssuite/utilities/sliceConfiguration/data/roleState.properties"
2016-08-10 00:12:01,260 [22575] - root - DEBUG - vcopsPlatformCommon - loadConfigFile - Loading config file "/usr/lib/vmware-vcopssuite/utilities/sliceConfiguration/data/roleState.properties"
2016-08-10 00:12:01,261 [22575] - root - DEBUG - vcopsPlatformCommon - copyPermissionsAndOwner - Updating file permissions of '/usr/lib/vmware-vcopssuite/utilities/sliceConfiguration/data/roleState.properties.new' from 100644 to 100660
2016-08-10 00:12:01,261 [22575] - root - DEBUG - vcopsPlatformCommon - copyPermissionsAndOwner - Updating file ownership of '/usr/lib/vmware-vcopssuite/utilities/sliceConfiguration/data/roleState.properties.new' from 1000/1003 to 1000/1003
2016-08-10 00:12:01,261 [22575] - root - DEBUG - vcopsPlatformCommon - UpdateDictionaryValue - The key: failureDetected was updated 
2016-08-10 00:12:01,261 [22575] - root - DEBUG - vcopsPlatformCommon - programExit - Updated failure detected to true 
2016-08-10 00:12:01,261 [22575] - root - INFO - vcopsPlatformCommon - programExit - Exiting with exit code: 1, Add slice to CaSA Cluster failed. Response code: 9000.  Expected: 200

Resolution:

Step #1

Take snapshot of all vROps nodes

Step #2

Revert back to VMware’s default certificate on all nodes using the following kb article. KB2144949

Step #3

The custom cert files that need to be renamed on the nodes are located at /storage/vcops/user/conf/ssl.  This should be completed on all nodes.   Alternatively, you can remove them, but renaming them is sufficient.

# mv customCert.pem customCert.pem.BAK
# mv customChain.pem customChain.pem.BAK
# mv customKey.pem customKey.pem.BAK
# mv uploaded_cert.pem uploaded_cert.pem.BAK   

Step #4

Now attempt to add the new node again.  From the master node, you can watch the installation of the new node by tailing the casa.log

# tail -f /storage/vcops/log/casa/casa.log

Delete the snapshots as soon as possible.

  • To add a new custom certificate to the vRealize Operations Manager, follow this KB article: KB2046591

_________________________________________________________________

Alternative Solutions

  • There could be an old management pak installed that was meant for an older version of vROps.  This has been know to cause failures.  Follow this KB for more information: KB2119769


  • If you are attempting to add a node to the cluster using an IP address previously used, the operation may fail.  Follow this KB for more information: KB2147076


Upgrading A Large vRealize Operations Manager (vROps) Appliance Cluster

Upgrading a multi-node vROps cluster can bring significant downtime to the monitoring/data collection abilities of the cluster.  The largest production cluster I am responsible for consists of nine data nodes, including the master and master replica, and four remote collectors for our remote data centers.  If you recall my previous post Sizing and Installing The vROps Appliance, I discussed the various sizing options of a vROps cluster based on the data collected, and in my case this cluster is configured as LARGE due to the size of our vROps cluster.  One of the biggest challenges of maintaining a large cluster, that has remote collectors collecting from data centers in different geographical locations, is the ability to upgrade the cluster with minimal downtime. As it stands now, if I were to upgrade this cluster with the traditional methods VMware provided, I would be looking at a minimal downtime of eight hours.  VMware does offer a useful work around: How to reduce update time by pre-copying software update PAK files KB2127895, and we will be using that here.

But first, I wanted to introduce you to a script developed by a Jeremy McCoy, and his repository over at github called nakedhitman.  In there you will find this awesome script called vROps Cluster Repair that I have personally used many times, and was recommended to me by VMware’s GSS. This script is intended to bring the vROps cluster back to a known healthy state, and I like to run it before upgrading my Production vROps clusters.  You will want to familiarize yourself with that script, download and get it setup with your environment details.

Preparing for the Upgrade

  • First – Run the nakedhitman’s – vROps Cluster Repair script.  This will cause a brief outage (max 30 minutes) as services are stopped on each vROps node for cleanup.  *I recommend taking a snapshot of all vROps nodes beforehand just in case.  Once the cluster comes online and starts collecting data, delete those snapshots.
  • Second – Insure you have enough free space on the appliances to support the upgrade.
  • Third – Complete a basic heath-check of the appliance outlined in my post: vRealize Operations Manager (vROps) Health-Check.  While not necessary, I have personally had upgrades fail due to the issues found in this health-check.
  • Fourth – Complete Part 1 of VMware KB2127895 article to get the upgrade paks pre-staged on all nodes except the master.  No downtime required as this can be done live.  The benefit of using this KB us that you are essentially removing the time it takes for the cluster to copy the two pak files around during the upgrade process, which could take hours depending on the size of the environment.

 Upgrading The Appliance Cluster

  1. Snapshot the cluster and remote collectors.  Take the cluster offline from the master’s admin page https://<vrops>/admin.  The the cluster is offline, shutdown the vrops appliance nodes in order of remote collector, data nodes, master replica and lastly the master.  Snapshot the VMs, and then boot the master first, wait for it to fully come up to the appliance login screen, and then boot the master replica, datanodes and remote collectors last.
  2. Log back into the master appliance Admin page, but do not bring the the cluster online.
  3. On the left pane select the Software Update tab, and then click the Install a Software Update… button.
  4. Browse for the PAK file and select it.
  5. Installation options……
    1. DO NOT select the option “Install the PAK file even if it is already installed.” – Think of this as a force install. This is used if the original software update failed and you are attempting to try again. This option will ignore the pre-staged PAK files you placed earlier, and severely delay the upgrade as the cluster will now have to copy the PAK files around to each of the nodes.
    2. You have the option to “Reset out-of-the-box content, overwriting to a newer version provided by this update. Note, user modifications to out-of-the-box alerts, Symptoms, Recommendations and Policies will be overwritten.”
  6. Click Upload.
  7. Accept the license agreement.
  8. Click Next.
  9. The upgrade will now start. Sit back, and Relax! The upgrade can take hours to complete. There are 9 steps to this.

vrops45

  • Eventually you will need to log back into the admin page to monitor the progress of the upgrade.  Since  6.2, you can check the status of the upgrade by clicking the little notebook next to each node.  If there’s an issue detected like in the screen capture below, it may not stop the upgrade from progressing, but you should take notice.  VMware has even started included KB article links to help troubleshoot.

vrops46

  • There are two places to watch the upgrade on the master at the log level if you’d like:
     # tail -f /storage/vcops/log/pakManager/vcopsPakManager.root.apply_system_update.log

    –and–

     # tail -f /storage/vcops/log/pakManager/vcopsPakManager.root.query.log
  • Once the installation is complete and at steps 9 of 9, go back to the system status tab and verify the system state is online with the little green check. VMware engineers have said that at this point the upgrade has completed successfully, and it is safe to remove the snapshots.

vrops47

  • Should the upgrade fail, open a severity 1 SR with VMware asap.
  • If the sun is shining and the upgrade finishes, delete those snapshots, and enjoy all the upgrades/bug fixes the new release brings.


As a side note…

I have submitted a couple feature requests to VMware in order to ease the upgrade process of large vROps installations.

  1. For multi-data center environments: The ability to have smaller appliances in each data center, with a single search head appliance connected to the multiple data center vROps deployments.  The idea here would be a “single pane of glass” to see all data centers like you get if there is a single large muli-node vROps cluster, with multiple remote collectors. Having smaller deployments accessible by a single search head would allow for the ability to take one deployment down per data center at a time to upgrade it, dramatically reducing  the data outage, and upgrade time.
  2. The ability to deploy the latest vROps appliance, and import the data from the old like VMware does with the vCSA.  The idea here is that this would be another way to reduce the upgrade time, and reduce the outage occurred by upgrading the appliance.
  3. Tying #1 and #2 together, the ability to stand up a new appliance in said remote data center, and then export that data centers specific data from the main large cluster to the smaller deployment, or the ability to just stand up a new appliance and import the data from the old one.

vRealize Operations Manager (vROps) Health-Check for versions prior to 6.5.

This post is not intended to be the traditional front-end health check on the appliance, and instead will focus on the back-end, specifically the Cassandra database on the data nodes.  I decided to write this post due to the various issues I have encountered managing two large production deployments, with the largest containing 9 data nodes, and 3 remote collectors collecting and processing metrics north of 3,829,804.

The first check we can do is on the database sync between the data nodes including the master and master replica.  This can also be useful in determining unusual disk growth on one or more of the data nodes. Open a SSH session to the master appliance and issue the following command:

# $VMWARE_PYTHON_BIN /usr/lib/vmware-vcops/tools/vrops-platform-cli/vrops-platform-cli.py getShardStateMappingInfo


The sample output to be concerned with looks similar to the following example:


{
   "stateMappings": {
    "vrops1": {
      "vRealize Ops Shard-0724c812-9def-4391-9efa-2395d701d43e": {
        "state": "SYNCHING"
      },
      "vRealize Ops Shard-77839361-986c-4817-bbb3-e7f4f1827921": {
        "state": "SYNCHING"
      },
      "vRealize Ops Shard-8469fdff-55f0-49f7-a0e7-18cd6cc288c0": {
        "state": "RUNNING"
      },
      "vRealize Ops Shard-8c8d1ce4-36a5-4f23-b77d-29b839156383": {
        "state": "RUNNING"
      },
      "vRealize Ops Shard-ab79572e-6372-48d2-990d-d21c884b46fb": {
        "state": "RUNNING"
      },
      "vRealize Ops Shard-bfa03b9e-bac9-4040-b1a8-1fd8c2797a6a": {
        "state""OUT_OF_SYNC"
      }
    }
  },

The “vRealize Ops Shard” refers to the data nodes including the master and master replica nodes. The available status’ are RUNNING, SYNCHING, BALANCING, OUT_OF_BALANCE, and OUT_OF_SYNC.

  • States of RUNNING, SYNCHING and BALANCING are normal healthy states.
  • OUT_OF_BALANCE and OUT_OF_SYNC status is cause for concern, and is enough to open an SR with VMware to have them take a look.  But lets look a little deeper to see if there’s more going on here.  It may be beneficial information to give to VMware’s GSS.

The vRealize Operations Manager appliance uses Apache Cassandra database, so with this next command, we will be looking at the database load using a Cassandra utility called node tool. This command is only gathering operational statistics from the database, so it is safe to run as we are not making any system changes here.

  • A good time to use this utility is when you start getting alerts from various datanodes stating high load, or that cassandra DB service has crashed and has now recovered, or that the data node has disconnected and reconnected.
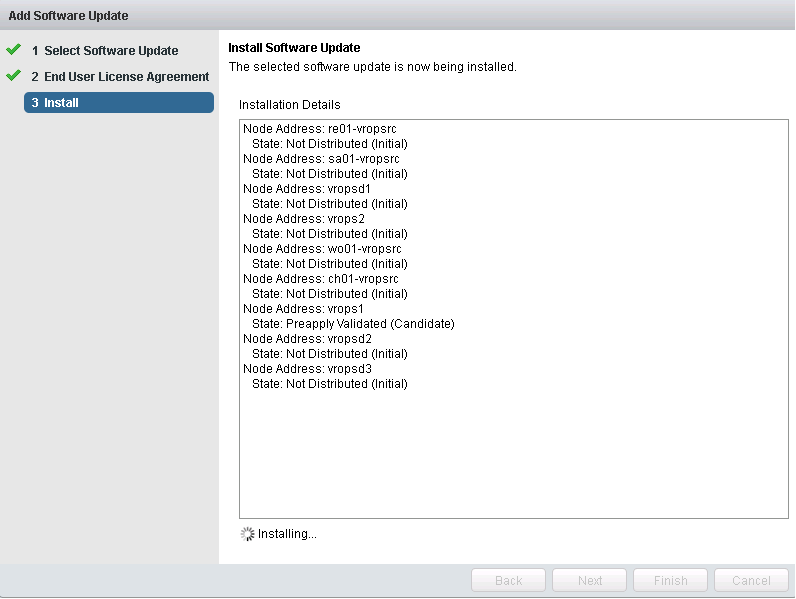
  • I’ve also noticed this to be a cause for failed upgrades, or failed vrops cluster expansions.
# $VCOPS_BASE/cassandra/apache-cassandra-2.1.8/bin/nodetool --port 9008 status

This will return output similar to:

Datacenter: datacenter1
=======================
Status=Up/Down
|/ State=Normal/Leaving/Joining/Moving
--   Address    Load    Tokens  Owns  Host ID                               Rack
UN   192.2.3.6  80.08 GB  256     ?   232f646b-3fbc-4388-8962-34000c1bb48b  rack1
UN   192.2.3.7  80.53 GB  256     ?   1bfec59b-3ba8-4ca0-942f-5bb2f97b7319  rack1
UN   192.2.3.4  80.11 GB  256     ?   da6c672c-cc69-4284-a8f5-2775441bb113  rack1
UN   192.2.3.5  79.33 GB  256     ?   ee4a3c3f-3f0f-46ac-b331-a816e8eb37c5  rack1
DN   192.2.3.3  75.13 GB  256     ?   19e80237-6f2c-4ff6-881e-ce94870e0ca5  rack1

Note: Non-system keyspaces don't have the same replication settings, 
effective ownership information is meaningless

———————————————————————–

  • The output to be concerned with here, is the load column.  Under ideal operational conditions, I have been told this should be under 5GB of load per node.  This command does not return data on the remote collectors because they do not contain a database.
  • If database load is over 5GB, you will need to open an SR VMware GSS with this information, along with sending them the usual appliance log bundle.  In this example, my data nodes had over 70 GB of load.
  • If nodetool returns with an error: nodetool: Failed to connect to ‘127.0.0.1:9008’ – ConnectException: ‘Connection refused’, checkout this KB2144358 article.  You may be able to get that node back online before calling GSS.

Concerning the database load, In most cases from my experience GSS would need to truncate the activity, results, and queueid tables, and then run a parallel nodetool repair command on all data nodes starting with the master in order to get the appliance’s feet back under it.  I will detail those steps here as these are the steps usually performed:

  1. Take a snapshot of the nodes: master, master replica, data nodes (Remote Collectors can be skipped) to ensure no issues arise.
  2. Leave the cluster ONLINE
  3. Take analytics offline on the master and all data nodes:
  • Perform this step in parallel. That is, execute this command on each node one-after-another without waiting for it to complete in a single terminal firstA simple for-loop calling ssh to the nodes to do this isn’t sufficient. It is best to ensure the master and data nodes are all going offline together.
# service vmware-vcops stop analytics

4.  Repair the RESORUCE_STATE_DELETE flags for non-existing resources that are to be deleted:

  • On the master node only execute:
# su - postgres -c "/opt/vmware/vpostgres/current/bin/psql -d vcopsdb -p 5433 -c \"update resource set resource_flag='RESOURCE_STATE_NORMAL' where resource_flag='RESOURCE_STATE_DELETE';\""

5.  Perform Cassandra maintenance on the master node only.  Afterword you will be running cassandra repair on the rest of the nodes that will sync up their databases with the master.  There are a total of four commands here, so run them in order:

# $VCOPS_BASE/cassandra/apache-cassandra-2.1.8/bin/cqlsh --ssl --cqlshrc $VCOPS_BASE/user/conf/cassandra/cqlshrc -e "consistency quorum; truncate globalpersistence.activity_tbl"
# $VCOPS_BASE/cassandra/apache-cassandra-2.1.8/bin/cqlsh --ssl --cqlshrc $VCOPS_BASE/user/conf/cassandra/cqlshrc -e "consistency quorum; truncate globalpersistence.activityresults_tbl"
# $VCOPS_BASE/cassandra/apache-cassandra-2.1.8/bin/cqlsh --ssl --cqlshrc $VCOPS_BASE/user/conf/cassandra/cqlshrc -e "consistency quorum; truncate globalpersistence.queueid_tbl"
# $VCOPS_BASE/cassandra/apache-cassandra-2.1.8/bin/nodetool -p 9008 clearsnapshot 

6.  Perform Cassandra maintenance on all nodes:

  • This is critical. The -pr option to the repair tool causes a subset of the token range to be coordinated from the node calling the nodetool. This improves performance however it is critical that ALL nodes in the Cassandra cluster perform this operation to get a complete and consistent repair.  See <www.datastax.com_dev_blog_repair-cassandra >
  • Execute this on the master and all data nodes simultaneously:
# $VCOPS_BASE/cassandra/apache-cassandra-2.1.8/bin/nodetool -p 9008 repair -par -pr

7. To monitor the repair progress, you can start another SSH session to the master node and tail the following log:

# tail -f /storage/log/vcops/log/cassandra/system.log
  • The repair operation has two distinct phases. First it calculates the differences between the nodes (repair work to be done), and then it acts on those differences by streaming data to the appropriate nodes.

Generally speaking, you can also monitor the nodetool repair operation with these two nodetool commands, but this is not necessary:

  • netstats: This monitors the repair streams to the nodes:
# $VCOPS_BASE/cassandra/apache-cassandra-2.1.8/bin/nodetool --port 9008 netstats
  • compactionstats: This checks on the active Merkle Tree calculations:
# $VCOPS_BASE/cassandra/apache-cassandra-2.1.8/bin/nodetool --port 9008 compactionstats

8. Perform the instance metric key id clean-up on all nodes.  Perform this step in parallel on the master and data nodes.  This cleans up the disk on the nodes, as this cleans up the snapshots of Cassandra on each node:

# $VMWARE_PYTHON_BIN $VCOPS_BASE/tools/persistenceTool.py RemoveMatchedMetricKeys --outputFile /tmp/deleted_report.txt --regex "\"^diskspace-waste:.+?snapshot:.*\"" --remove true # $VMWARE_PYTHON_BIN $VCOPS_BASE/tools/persistenceTool.py RemoveMatchedMetricKeys --outputFile /tmp/deleted_report2.txt --regex "\"^diskspace:.+?snapshot:.*(accessTime|used)$\"" --remove true

9.  Clean up the alarms & alerts on all nodes.   Perform this step in parallel on the master and data nodes:

# su - postgres -c "/opt/vmware/vpostgres/9.3/bin/psql -p 5432 -U vcops -d vcopsdb -c 'truncate table alert cascade;'"
# su - postgres -c "/opt/vmware/vpostgres/9.3/bin/psql -p 5432 -U vcops -d vcopsdb -c 'truncate table alarm cascade;'"

10.  Bring the analytics processes back online.   Execute this step on the master, master replica and data nodes. You may use a ssh for-loop and execute these commands sequentially:

# service vmware-vcops start analytics
  • I have seen the cluster to take 20 to 30 minutes to come back online (from my experience with a 9+ node large cluster).
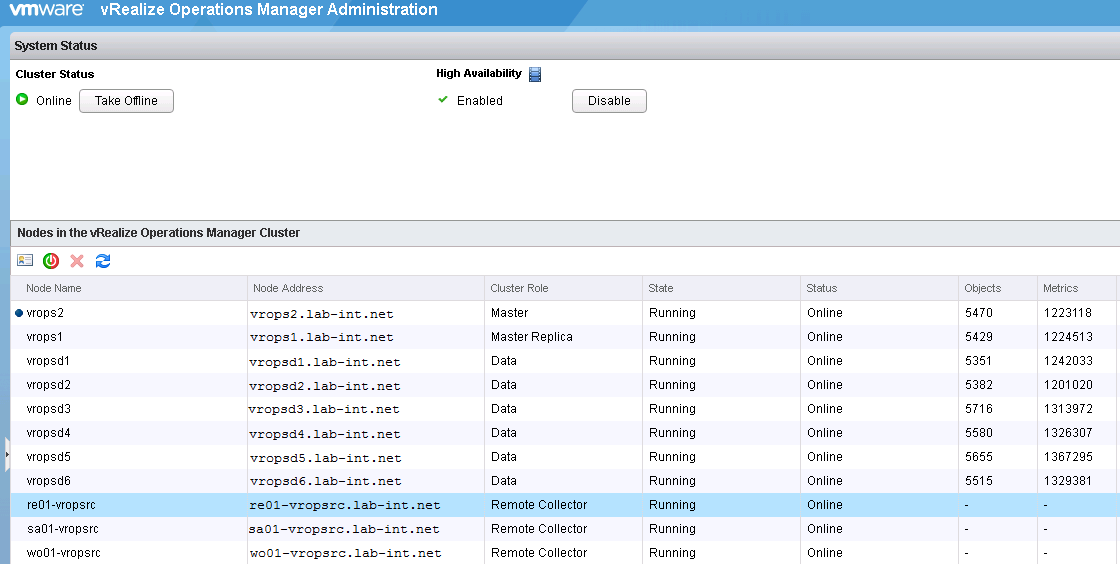
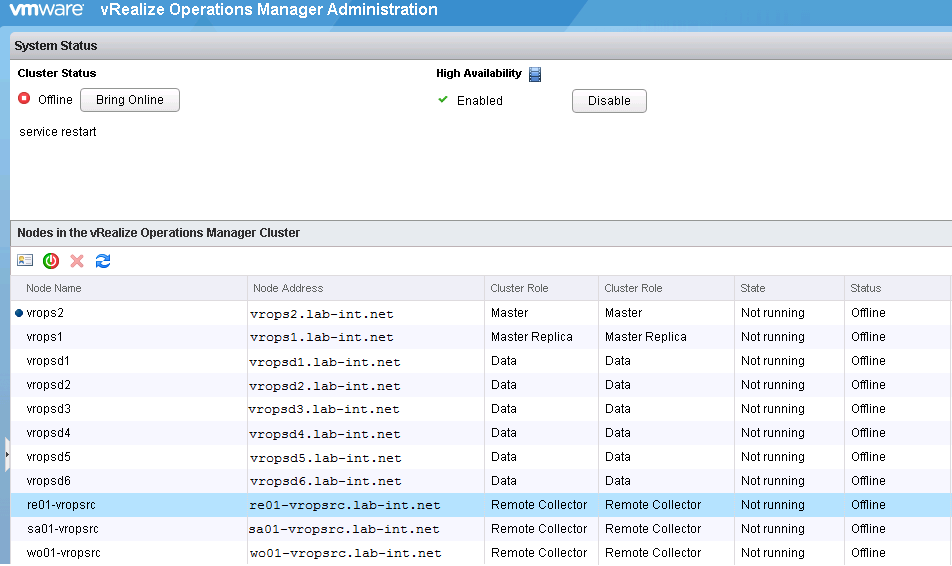
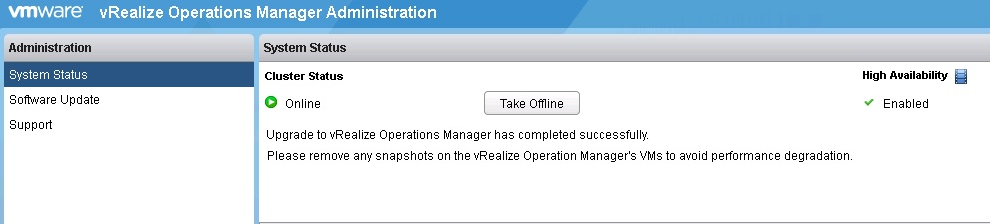
  • If you log into the https://<vrops>/admin page, you will see that the HA status is degraded, or needs to be re-enabled.  Give the appliance time as it will reset itself back to a healthy green state, once fully online.

11. Once the cluster is fully online and you can confirm the data is being collected, delete the snapshots you took earlier.

12. On the master node, if you again run the command:

# $VMWARE_PYTHON_BIN /usr/lib/vmware-vcops/tools/vrops-platform-cli/vrops-platform-cli.py getShardStateMappingInfo

You should see something similar to:

{
   "stateMappings": {
    "vrops1": {
      "vRealize Ops Shard-0724c812-9def-4391-9efa-2395d701d43e": {
        "state": "SYNCHING"
      },
      "vRealize Ops Shard-77839361-986c-4817-bbb3-e7f4f1827921": {
        "state": "SYNCHING"
      },
      "vRealize Ops Shard-8469fdff-55f0-49f7-a0e7-18cd6cc288c0": {
        "state": "RUNNING"
      },
      "vRealize Ops Shard-8c8d1ce4-36a5-4f23-b77d-29b839156383": {
        "state": "SYNCHING"
      },
      "vRealize Ops Shard-ab79572e-6372-48d2-990d-d21c884b46fb": {
        "state": "SYNCHING"
      },
      "vRealize Ops Shard-bfa03b9e-bac9-4040-b1a8-1fd8c2797a6a": {
        "state": "SYNCHING"
      }
    }
  },

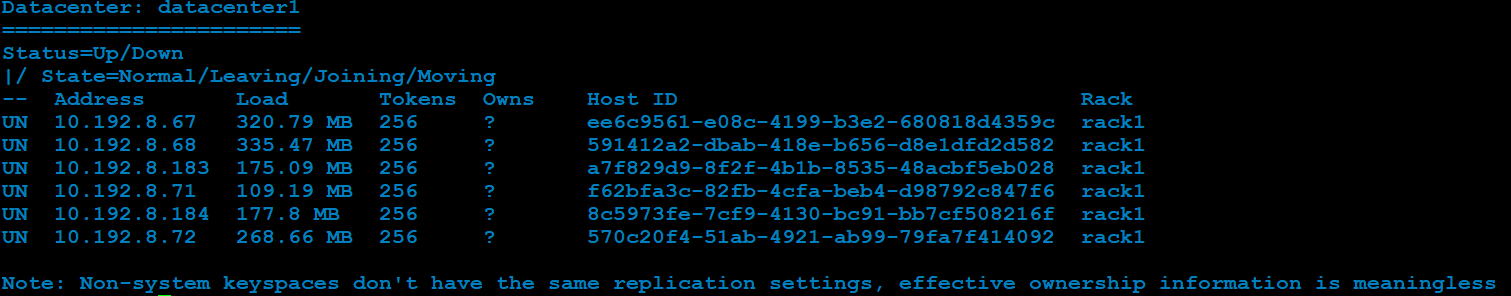
13. On the master node, if you again run the nodetool status command

# $VCOPS_BASE/cassandra/apache-cassandra-2.1.8/bin/nodetool --port 9008 status

You should see something similar to:

Datacenter: datacenter1
=======================
Status=Up/Down
|/ State=Normal/Leaving/Joining/Moving
--   Address    Load    Tokens  Owns  Host ID                               Rack
UN   192.2.3.6  120.20 MB  256     ?   232f646b-3fbc-4388-8962-34000c1bb48b  rack1
UN   192.2.3.7  128.20 MB  256     ?   1bfec59b-3ba8-4ca0-942f-5bb2f97b7319  rack1
UN   192.2.3.4  120.11 MB  256     ?   da6c672c-cc69-4284-a8f5-2775441bb113  rack1
UN   192.2.3.5  115.33 MB  256     ?   ee4a3c3f-3f0f-46ac-b331-a816e8eb37c5  rack1
DN   192.2.3.3  128.13 MB  256     ?   19e80237-6f2c-4ff6-881e-ce94870e0ca5  rack1

Note: Non-system keyspaces don't have the same replication settings, 
effective ownership information is meaningless
  • The ideal situation here is that now the Cassandra DB load should be around 1GB or less

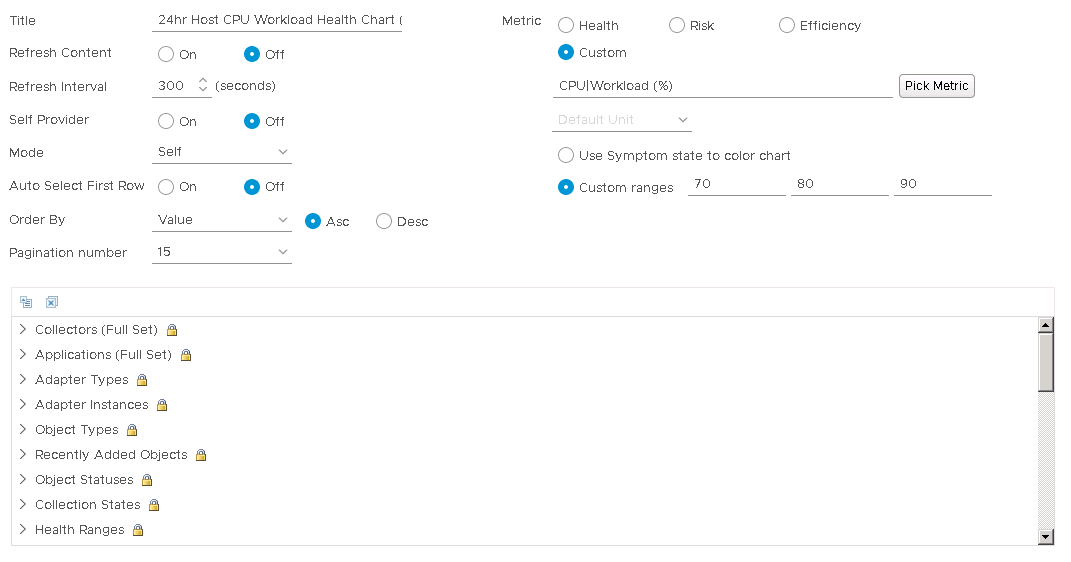
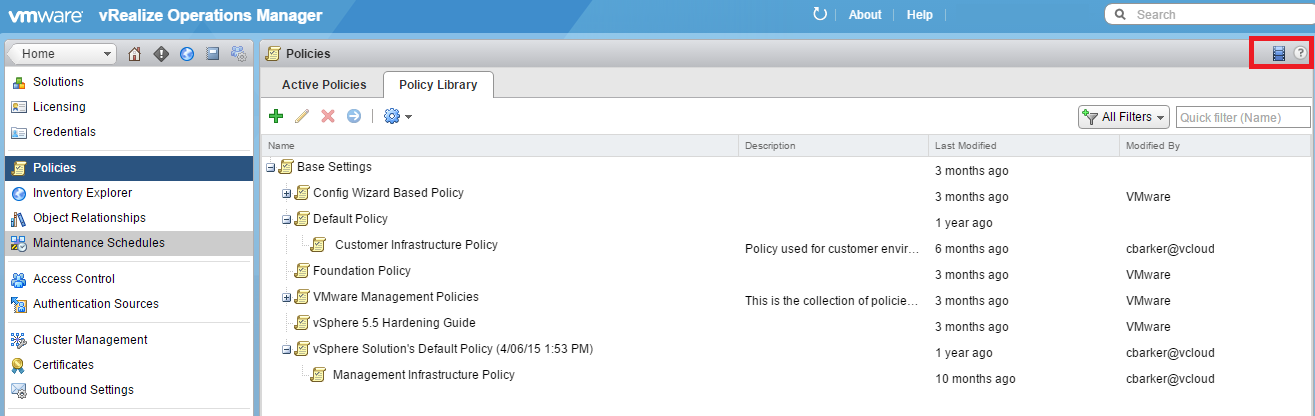
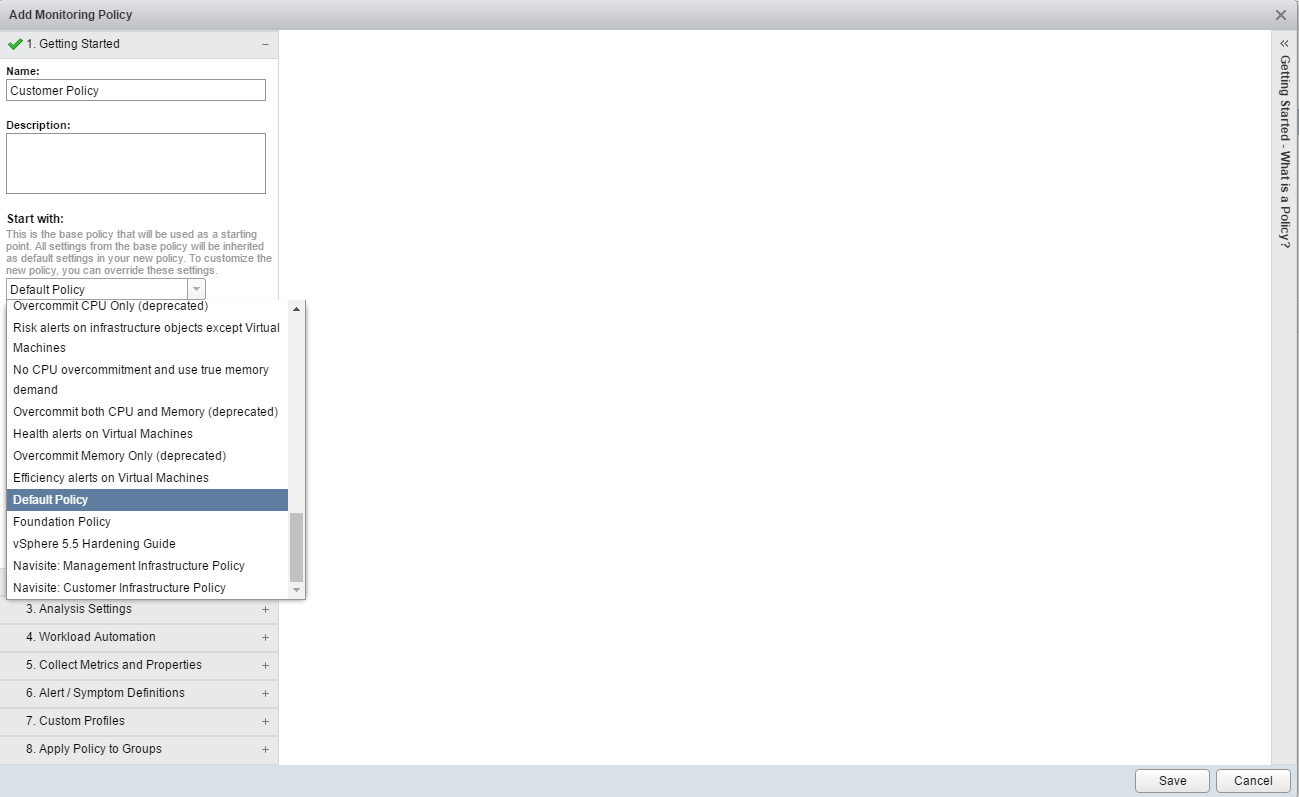
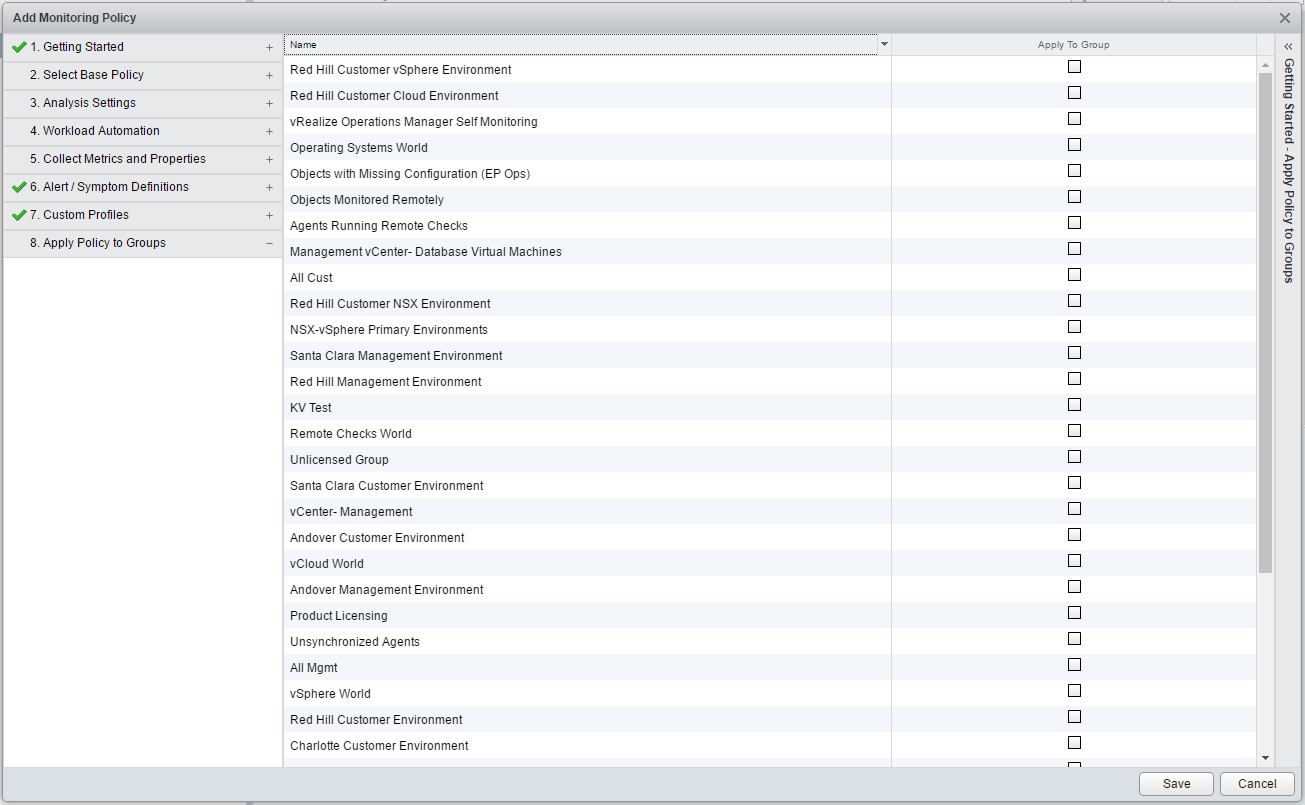
14.   Log into the regular web interface and edit the policy to stop collections on snapshot metrics. This will help in overall performance going forward.


Creating vROps Policies and How To Apply Them To Object Groups.

Creating policies in VMware’s vRealize Operations Appliance can be strait forward, if there is a decent understanding of every platform it’s monitoring.  In my last post of this series, I covered the creation of object groups, and that post is important here because policies can be created and assigned to those object groups, allowing the tuning of alerts received for those groups.

Once logged in to the vROps appliance, go into the administration section, and there you will find the policies.

vrops37.png

  • VMware has included many base policies in the policy library, which in most cases will be fine for the initial configuration for the appliance, but you may want to create additional policies to suite your specific environment needs.
  • Also take note of the blue film strip in the upper right corner.  This will take you to VMware’s video repository of policies explanation and a brief how-to video.  These video links can be found throughout the configuration of the appliance, and more are added with each release.

To create a new policy click on the green plus sign to get started.  Give the policy a unique name, and it would be good practice to give a description of what the policy is intended to do.  When creating a policy, you have the ability to “start with” a VMware pre-defined policy, and I recommend taking advantage of that until there is a firm understanding of what these policies do.

vrops38

On the Select Base Policy tab, you can use the drop down menu on the left to get a policy overview of what is being monitored.  In this example, Host system was selected.

vrops39

Policy Overrides can also be incorporated into this policy.  In other words, if there are certain alerts that you do not want, one of the pre-defined policies may already have those alerts turned off, so those policies can be added to the new policy being created here.  Work smarter, not harder right?

vrops40

Moving along to the Analysis Settings tab, here you can see how vROps analyses the alerts, determines thresholds, and assigned system badges.  These can be left at their current settings per the policy you are building off of, or you can click on the padlock to the right and make individual changes.  Keep in mind under the “Show changes for” drop down menu, you will have many objects to select to change the analysis settings on.

vrops41

The Alert/Systems Definitions tab is probably where the majority of time will be spent.  The “Alert Definitions” box at the top is where alerts can be turned on or off based on the base policy used to create this one, or the override policies used.

  • Each management pack installed will have it’s own category for object type.  In other words, “host system” is listed under the vCenter category, but if vCloud Director management pack was installed, it would also have a “host system” under its category.  Each management pack has the ability to add additional alerts for objects referenced in other management packs.  Take time going through each category to see what alerts may need configuring.
  • The State of each alert will either be local with a green check-mark: meaning you enabled it, inherited with a grey check-mark: meaning it is enabled via another policy that was used to create this one, Local with the red crossed out circle: meaning you disabled the alert for the policy, or inherited with a grayed out crossed out circle: meaning it is disabled via another policy that was used to create this one.  Disabling alerts here will still allow the metrics to be collected for the object, you just wont get the alarm for it.
  • The System Definitions section has the same “object type” drop down menu, and you can select the object type here to configure system thresholds for how the symptoms are triggered for the alert selected in the top Alert Definition box above.  I typically do these in tandem.

vrops43

Finally, you can apply the policy to the custom groups you created before in the Apply Policy to Groups tab.

vrops42

Once you click save, and go back to the Active Policies tab, you will be able to see the new policy created, and within five minutes, you should see the Affected Objects count rise.  You can see here that I have a policy marked with “D” meaning it is the default appliance policy.  You can set your own policy as default by clicking the blue circle icon with the arrow on the upper left side.  It may take up to 24 hours before the active alert page reflects the settings of the new policy.  Otherwise you can manually clear those alerts.

vrops44

Previous post to this series: Configuring VMware vRealize Operations Manager Object Groups

Configuring VMware vRealize Operations Manager Object Groups

There are two sections I will cover in this post: ‘Group Types’ and ‘Object groups’.  An example of when you might want to consider creating a group type …lets say you have multiple data centers, a group type could be used as a way to group all objects types of that data center into one folder.  In other worlds: The group type for the data center in Texas would be used as a sorting container for the group objects such as data stores, vCenters, hosts, virtual machines, etc.. and keep them separated from the data center in New York.

The way you can do this is by clicking on the Content icon, selecting group types and then clicking the green plus sign to add a new group type.

vrops28

Next you can click on the environment icon (blue globe), Environment Overview, click the green plus icon to create a new object group, and then in the group type drop down, you can select the group type you just created.  As far as policy selection goes, the built in VMware policies are a great place to start.  You can easily update this selection later when you create a custom policy.  I would recommend checking ‘Keep group membership up to date’.

vrops29

Define membership criteria section.  This is where the water can get muddy as you will have more than one way to target your desired environment objects.  In the drop down menu ‘Select the Object Type that matches all of the following criteria’, the object types selection can grow in number depending how many additional adapter Management PAKs are installed on the vROps appliance.  This selection will also be important because of the way vROps alerts off from the management packs.

– An example would be alerts on Host Systems.  One would assume you would select the vCenter Adapter and then select Host Systems, however  if you have the vCloud Director Adapter Management PAK installed for example, that PAK also has metrics for Host Systems that vROps will alert from,  you would also need to select Host systems under that solution to target those alerts and systems as well.

vrops30

For this example, we will use the Host System under the vCenter Adapter.  There are different ways to target the systems, for this example I will showcase using Object name, contains option.  This option allows us to target several systems IF they have a common name like so:

vrops31

You also have the option to target systems based on their Relationship.  In this example we have clusters of hosts group under the name of MGMT, so I chose Relationship, Child of, contains, MGMT – to target all systems in that cluster like so:

vrops32

There is a Preview button in the lower left corner which you can use to see if your desired systems are picked up by the membership criteria you selected.

vrops33

You can also target multiple system names by using the Add another criteria set option like so:

vrops34

Depending on the size of the environment, I’ve noticed that it helps to make a selection in the ‘in navigation tree’ drop down as well

When you have the desired systems targeted in the group, click OK.  Groups are subject to the metrics interval collection, so the groups page will show grey question marks next to the groups until the next interval has passed.  Any policies that were applied to these custom groups will not change the alerts page until that metrics collection has occurred.

The added benefit to having custom groups is that vROps will also show you the group health, and if you click on the group name you will be brought to a custom interface with alerts only for that group of targeted systems.

vrops35

In my next post I will go over the creating of policies and how to apply them to object groups.


Next Post: Creating vROps Policies and How To Apply Them To Object Groups.

Previous Post: Add The vROps License, Configuring LDAP, and The SMTP For vRealize Operations Manager (vROps)