
December 2023
Aria Operations 8.12.1
For the past couple of months, I have been working with a customer developing Aria Operations (formally vROps) dashboards for various interests. The dashboard I’ll cover here was one I created to help them track and identify the guest file system usage of the virtual machine. This works for both Microsoft and Linux based systems.

Box 1a is a heatmap widget configured as a self provider configured to refresh every 300 seconds. Additional configuration as follows:

The heatmap is a nice visual that will turn red as the guest file system consumes disks on the VM to spot problems. You then select a box in the heatmap to populate the 2a. Box 2a then feeds data into 2b, 2c, 2d, and 2e.
Box 2a is a custom list view widget i created that lists several metrics of the virtual machine with custom metric labels. It is configured to auto select the first row.

Those metrics are:
“Badge|Health%“,
“Configuration|Hardware|Disk Space“,
“Guest File System|Utilization (%)“, (Coloring above: Yellow 75, Orange 80, Red 90);
“Virtual Disk:Aggregate of all instances|Read IOPS“, (Coloring above: Yellow 100, Orange 200, Red 300);
“Virtual Disk:Aggregate of all instances|Write IOPS“, (Coloring above: Yellow 100, Orange 200, Red 300);
“Virtual Disk:Aggregate of all instances|Read Latency (ms)“, (Coloring above: Yellow 10, Orange 20, Red 30);
“Virtual Disk:Aggregate of all instances|Write Latency (ms)“, (Coloring above: Yellow 10, Orange 20, Red 30);
“Datastore:Aggregate of all instances|Total Latency (ms)“,
“Datastore:Aggregate of all instances|Total Throughput“,
“Disk Space|Snapshot|Age (Days)“, (Coloring above: Yellow 7, Orange 14, Red 21);
“Disk Space|Snapshot Space“.

Box 2b is a Scoreboard widget configured to list the selected VM details regarding information on how the VM is configured.
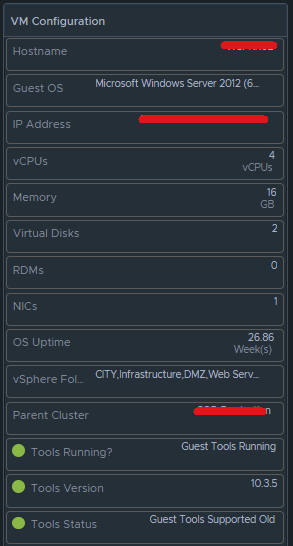
Configuration is set like so:
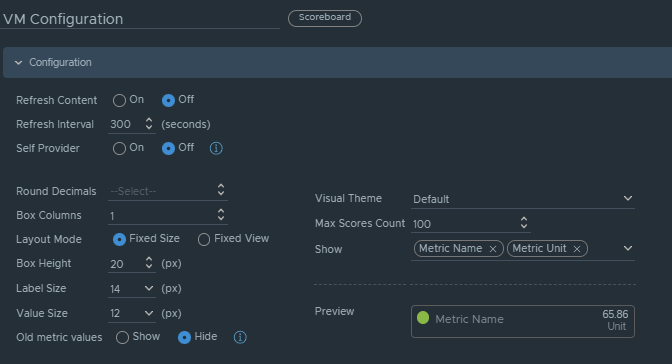
Under Input Transformation, set to self.
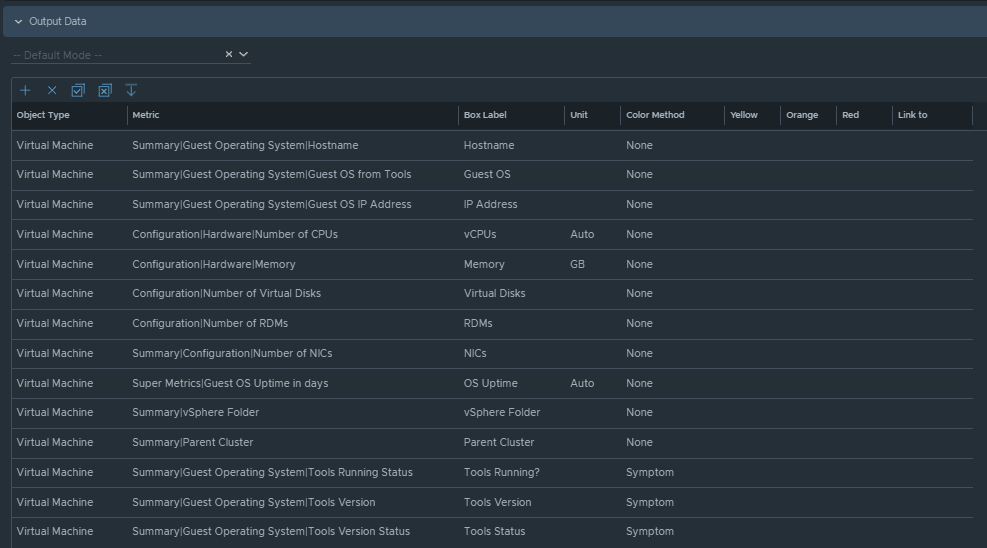
Output Data will be configured as follows:
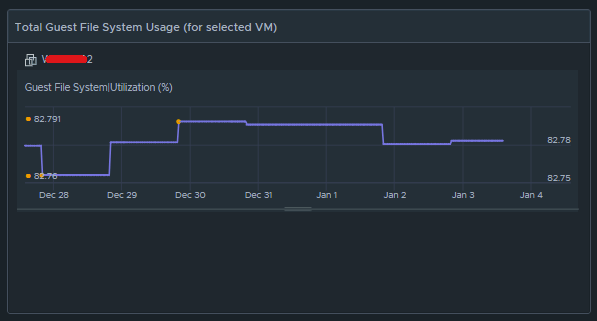
Box 2c is a metric chart widget with the Input Transformation configured as self, and the Output data configured to use the virtual machine metric “Guest File System|Utilization”.
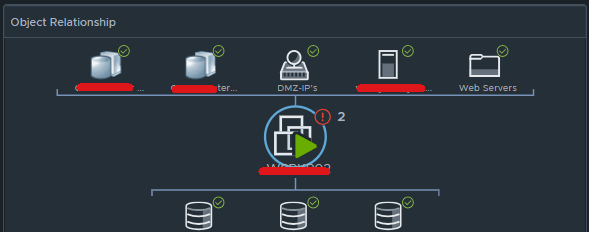
Box 2d is simply the Object Relationship widget.
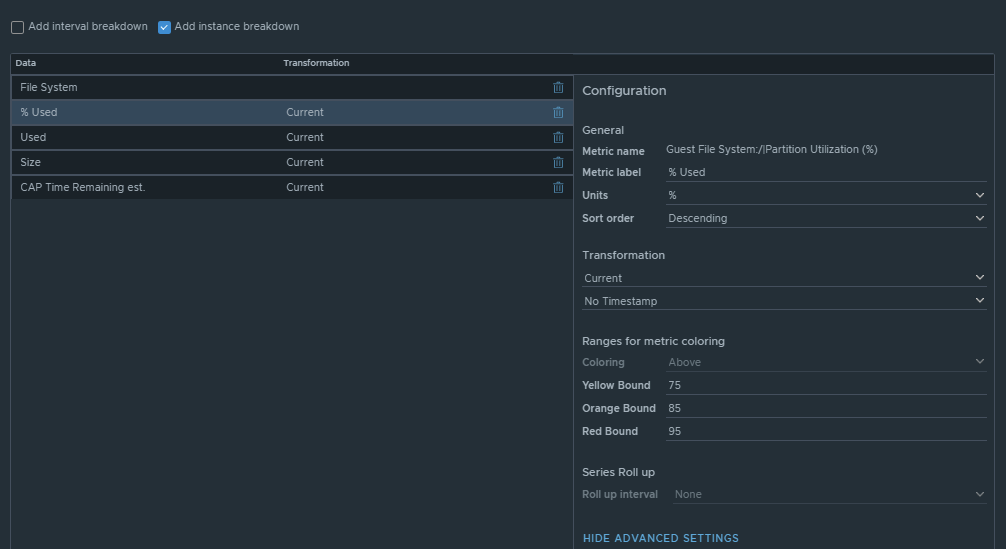
Box 2e is another custom list view and is configured to refresh every 300 seconds.
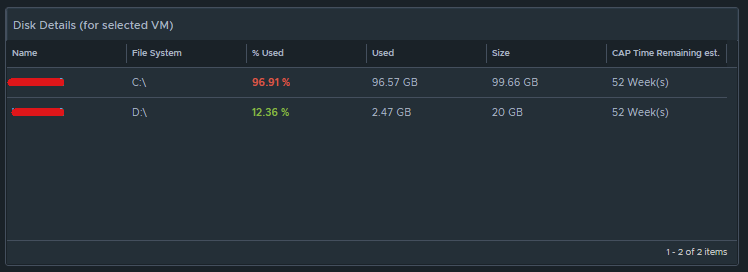
This list view is configured to do an instance breakdown of the following metrics:
“Guest File System:/|Partition Utilization (%)“, (Coloring above: Yellow 75, Orange 85, Red 95);
“Guest File System:/|Partition Utilization“;
“Guest File System:/|Partition Capacity (GB)“;
“Capacity Analytics Generated|Time Remaining“.
Box 3a is fed data from 2e so that we can see how the virtual machine disks are behaving on the datastore(s).
This is another custom list view configured as follows:
Configuration is set to refresh content at 300 seconds. Output data is configured with a custom list view with the following metrics:
“Devices:Aggregate of all instances|Read Latency (ms)“, (Coloring above: Yellow 10, Orange 20, Red 30);
“Devices:Aggregate of all instances|Write Latency (ms)“, (Coloring above: Yellow 10, Orange 20, Red 30);
“Devices:Aggregate of all instances|Read IOPS“, (Coloring above: Yellow 100, Orange 200, Red 300);
“Devices:Aggregate of all instances|Write IOPS“, (Coloring above: Yellow 100, Orange 200, Red 300);
“Devices:Aggregate of all instances|Read Throughput“;
“Devices:Aggregate of all instances|Write Throughput“.

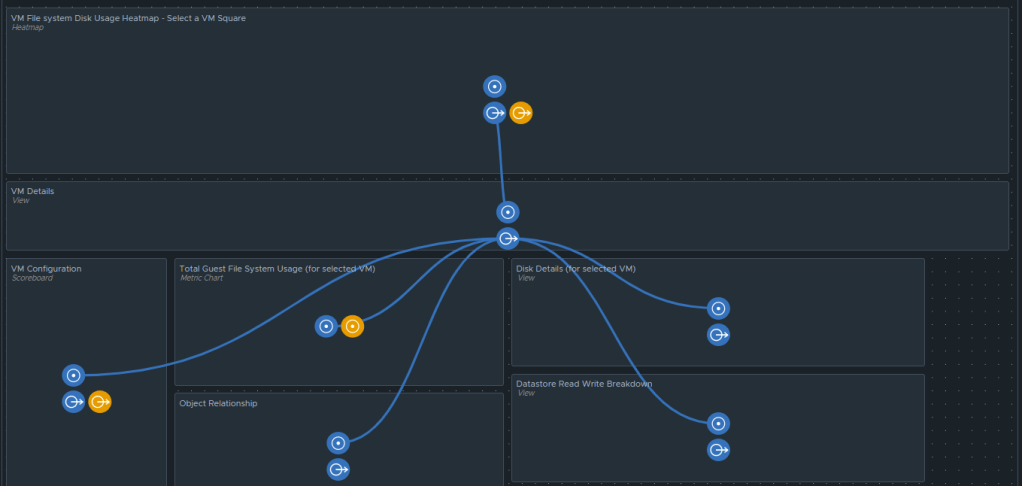
Those are all of the configured widgets on this dashboard. The integration schema will look like this:
I do hope to share this dashboard with the VMware Code sample exchange, and I will update this blog once that has been completed. I hope my breadcrumbs above will enable you to create a similar dashboard in the meantime.

You must be logged in to post a comment.