Introducing the new VMware vSAN 6.5 Hands-on Lab! Try it out today:
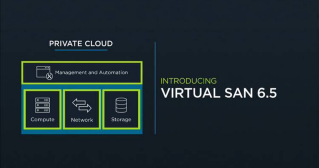
Introducing the new VMware vSAN 6.5 Hands-on Lab!
Explore new features like iSCSI Target, PowerCLI and more in vSAN 6.5.
Introducing the new VMware vSAN 6.5 Hands-on Lab! Try it out today:
Explore new features like iSCSI Target, PowerCLI and more in vSAN 6.5.
You ever hear the phrase “first one in, last one out”? That is the methodology you should use when the need arises to shutdown or startup a vRealize Operations Manager (vROps) cluster. The vROps master should always be the last node to be brought offline in vCenter, and the first node VM to be started in vCenter.
The proper shutdown sequence is as follows:
The remote collectors can be brought down at any time. When shutting down the cluster, it is important to “bring the cluster offline”. Thing of this as a graceful shutdown of all the services in a controlled manor. You do this from the appliance admin page
1. Log into the admin ui…. https://<vrops-master>/admin/
2. Once logged into the admin UI, click the “Take Offline” button at the top. This will start the graceful shutdown of services running in the cluster. Depending on the cluster size, this can take some time.
3. Once the cluster reads offline, log into the vCenter where the cluster resides and begin shutting down the nodes, starting with the datanodes, master replica, and lastly the master. The remote collectors can be shutdown at any time.
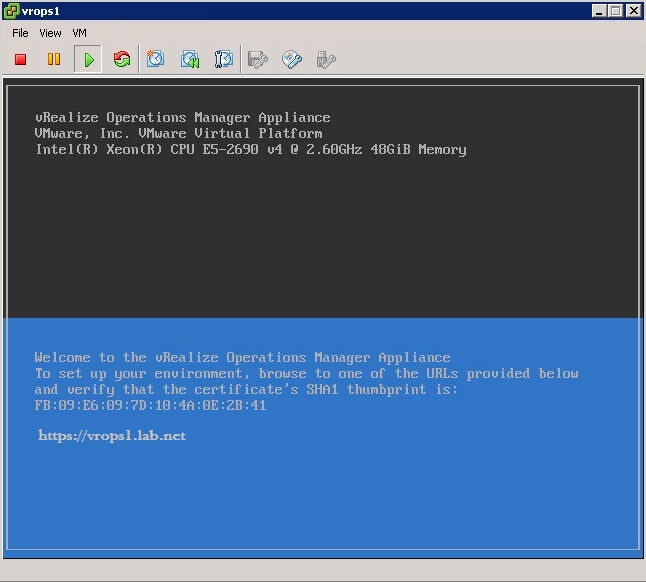
4. When ready, open a VM console to the master VM and power it on. Watch the master power up until it reaches the following splash page example. It may take some time, and SUSE may be running a disk check on the VM. Don’t touch it if it is, just go get a coffee as this may take an hour to complete.
The proper startup sequence is as follows:
5. Power on the master replica, and again wait for it to fully boot-up to the splash page example above. Then you can power on all remaining data nodes altogether.
6. Log into the admin ui…. https://<vrops-master>/admin/
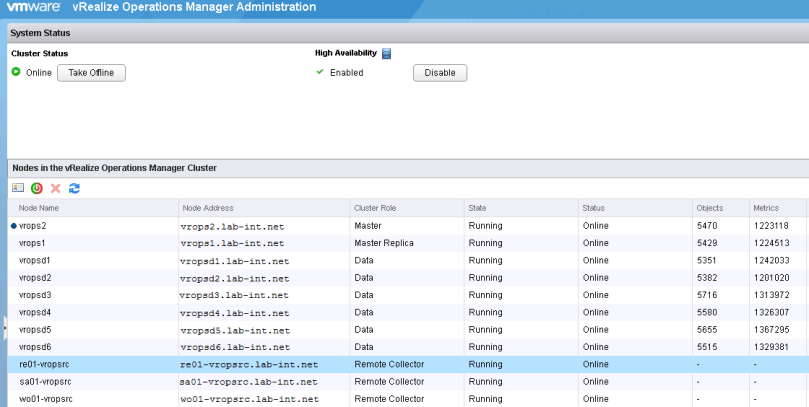
7. Once logged in, all the nodes should have a status of offline and in a state of Not running before proceeding. If there are nodes with a status of not available, the node has not fully booted up.
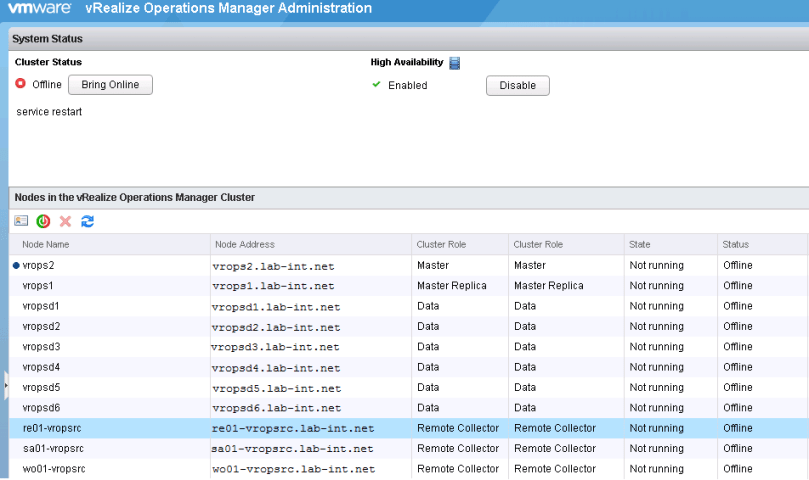
8. Once all nodes are in the preferred state, bring the cluster online through the admin UI.
If there was a need to shutdown the cluster from the back-end using the same sequence, but you should always use the Admin UI when possible:
Proper shutdown:
You would need to perform the following command to bring the slice offline. Each node is considered to be a slice. You would do this on each node.
# service vmware-vcops-web stop; service vmware-vcops-watchdog stop; service vmware-vcops stop; service vmware-casa stop
$VMWARE_PYTHON_BIN /usr/lib/vmware-vcopssuite/utilities/sliceConfiguration/bin/vcopsConfigureRoles.py --action=bringSliceOffline --offlineReason=troubleshooting
If there was a need to startup the cluster from the back-end using the same sequence, but you should always use the Admin UI when possible:
Proper startup:
You would need to perform the following command to bring the slice online. Each node is considered to be a slice. You would do this on each node.
# $VMWARE_PYTHON_BIN $VCOPS_BASE/../vmware-vcopssuite/utilities/sliceConfiguration/bin/vcopsConfigureRoles.py --action bringSliceOnline
# service vmware-vcops-web start; service vmware-vcops-watchdog start; service vmware-vcops start; service vmware-casa start
If there is a need to check the status of the running services on vROps nodes, the following command can be used.
# service vmware-vcops-web status; service vmware-vcops-watchdog status; service vmware-vcops status; service vmware-casa status
Syslogs, we all use them in some form or another, and most places have their syslogs going to a collection server like Splunk or VMware’s own vRealize Log insight. In the event you have an alert configured that notifies you when an ESXi host has stopped sending syslogs to the logging server, or you get a “General System Error” when attempting to change the syslog.global.logdir configuration option on the ESXi host itself, you should open a secure shell to the ESXi server and investigate further.
1. Once a secure shell has been established with the ESXi host, check the config of the vmsyslogd service, and that the process is running by using the following command:
# esxcli system syslog config get
Default Network Retry Timeout: 180Local Log Output:/vmfs/volumes/559dae9e-675318ea-b724-901b0e223e18/logsLocal Log Output Is Configured:trueLocal Log Output Is Persistent:trueLocal Logging Default Rotation Size: 1024 Local Logging Default Rotations: 8Log To Unique Subdirectory:trueRemote Host: udp://logging-server.mydomain-int.net:514
2. If the process is up, look for the current syslog process with the following command:
# ps -Cc | grep vmsyslogd
3. If the service is running, the output received would be similar to the example below. If there is no output, then the vmsyslogd service is dead and needs to be started. Skip ahead to step 5 if this is the case.
132798531 132798531 vmsyslogd/bin/python-OO/usr/lib/vmware/vmsyslog/bin/vmsyslogd.pyo132798530 132798530 wdog-132798531/bin/python-OO/usr/lib/vmware/vmsyslog/bin/vmsyslogd.pyo
4. In this example, we would need to kill the vmsyslogd and wdog processes before we can restart the syslog daemon on the host.
# kill -9 132798530
# kill -9 132798531
5. To start the process issue the following command:
# /usr/lib/vmware/vmsyslog/bin/vmsyslogd
6. Verify that the process is correctly configured and running again.
# esxcli system syslog config get Default Network Retry Timeout: 180Local Log Output:/vmfs/volumes/559dae9e-675318ea-b724-901b0e223e18/logsLocal Log Output Is Configured:trueLocal Log Output Is Persistent:trueLocal Logging Default Rotation Size: 1024 Local Logging Default Rotations: 8Log To Unique Subdirectory:trueRemote Host: udp://logging-server.mydomain-int.net:514
7. Log into the syslog collection server and verify the ESXi host is now properly sending logs.
-=Creating snapshots=-
Let’s say you are doing a maintenance, and need a quick way to snapshot certain VMs in the vCenter. The create_snapshot.ps1 PowerShell does just that, and it can be called from PowerCli.


> .\create_snapshot.ps1 -vm <vm-name>,<vm-name> -name snapshot_name
Like so:

In vCenter recent tasks window, you’ll see something similar to:

-=Removing snapshots=-
Once you are ready to remove the snapshots, the remove_snapshot.ps1 PowerShell script does just that.
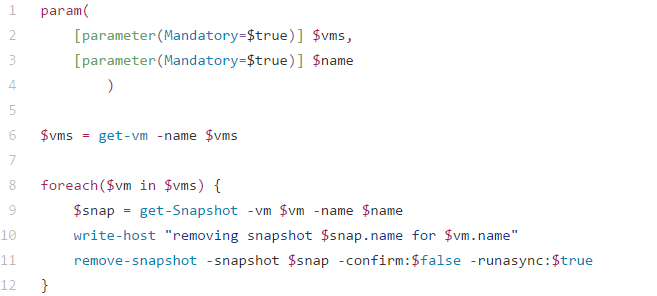
> .\remove_snapshot.ps1 -vm xx01-vmname,xx01-vmname -name snapshot_name
Like so:

In vCenter recent tasks window, you’ll see something similar to:

Those two PowerShell scripts can be found here:
create_snapshot.ps1 and remove_snapshot.ps1
_________________________________________________________________
-=Creating snapshots=-
The PowerCLi New-Snapshot cmdlet allows the creation of snapshots in similar fashion, and there’s no need to call on a PowerShell script. However can be slower
> get-vm an01-jump-win1,an01-1-automate | new-snapshot -Name "cbtest" -Description "testing" -Quiesce -Memory

Keep in mind using these options increases the time required to take the snapshot, but it should put the virtual machine back in the exact state if you need to restore back to it.
-=Listing Snapshots=-
If you need to check the vCenter for any VM that contains snapshots, the get-snapshot cmdlet allows you to do that. You can also use cmdlets like format-list to make it easier to read.
> Get-vm | get-snapshot | format-list vm,name,created

Other options:
Description
Created
Quiesced
PowerState
VM
VMId
Parent
ParentSnapshotId
ParentSnapshot
Children
SizeMB
IsCurrent
IsReplaySupported
ExtensionData
Id
Name
Uid
-=Removing snapshots=-
The PowerCLi remove-snapshot cmdlet does just that, and used in combination with the get-snapshot cmdlet looks something like this.
> get-snapshot -name cbtest -VM an01-jump-win1,an01-1-automate | remove-snapshot -RunAsync -confirm:$false

The Issue:
Unable to add additional nodes to cluster. This error happened while adding an additional data and remote collector. The cause ended up being a expired customer certificate, and surprisingly there was no noticeable mechanism such as a yellow warning banner in vROps UI to warn that a certificate had expired, or is about to expire.
Troubleshooting:
Log into the the new node being added, and tail the vcopsConfigureRoles.log
# tail -f /storage/vcops/log/vcopsConfigureRoles.log
You would see entries similar to:
2016-08-10 00:11:56,254 [22575] - root - WARNING - vc_ops_utilities - runHttpRequest - Open URL: 'https://localhost/casa/deployment/cluster/join?admin=172.22.3.14' returned reason:
[SSL: CERTIFICATE_VERIFY_FAILED] certificate verify failed (_ssl.c:581), exception:
2016-08-10 00:11:56,254 [22575] - root - DEBUG - vcopsConfigureRoles - joinSliceToCasaCluster - Add slice to CaSA cluster response code: 9000
2016-08-10 00:11:56,254 [22575] - root - DEBUG - vcopsConfigureRoles - joinSliceToCasaCluster - Expected response code not found. Sleep and retry. 0
2016-08-10 00:12:01,259 [22575] - root - INFO - vcopsConfigureRoles - joinSliceToCasaCluster - Add Cluster to slice response code: 9000
2016-08-10 00:12:01,259 [22575] - root - INFO - vc_ops_logging - logInfo - Remove lock file: /usr/lib/vmware-vcopssuite/utilities/sliceConfiguration/conf/vcops-configureRoles.lck
2016-08-10 00:12:01,259 [22575] - root - DEBUG - vcopsPlatformCommon - programExit - Role State File to Update: '/usr/lib/vmware-vcopssuite/utilities/sliceConfiguration/data/roleState.properties'
2016-08-10 00:12:01,260 [22575] - root - DEBUG - vcopsPlatformCommon - UpdateDictionaryValue - Update section: "generalSettings" key: "failureDetected" with value: "true" file: "/usr/lib/vmware-vcopssuite/utilities/sliceConfiguration/data/roleState.properties"
2016-08-10 00:12:01,260 [22575] - root - DEBUG - vcopsPlatformCommon - loadConfigFile - Loading config file "/usr/lib/vmware-vcopssuite/utilities/sliceConfiguration/data/roleState.properties"
2016-08-10 00:12:01,261 [22575] - root - DEBUG - vcopsPlatformCommon - copyPermissionsAndOwner - Updating file permissions of '/usr/lib/vmware-vcopssuite/utilities/sliceConfiguration/data/roleState.properties.new' from 100644 to 100660
2016-08-10 00:12:01,261 [22575] - root - DEBUG - vcopsPlatformCommon - copyPermissionsAndOwner - Updating file ownership of '/usr/lib/vmware-vcopssuite/utilities/sliceConfiguration/data/roleState.properties.new' from 1000/1003 to 1000/1003
2016-08-10 00:12:01,261 [22575] - root - DEBUG - vcopsPlatformCommon - UpdateDictionaryValue - The key: failureDetected was updated
2016-08-10 00:12:01,261 [22575] - root - DEBUG - vcopsPlatformCommon - programExit - Updated failure detected to true
2016-08-10 00:12:01,261 [22575] - root - INFO - vcopsPlatformCommon - programExit - Exiting with exit code: 1, Add slice to CaSA Cluster failed. Response code: 9000.  Expected: 200
Resolution:
Step #1
Take snapshot of all vROps nodes
Step #2
Revert back to VMware’s default certificate on all nodes using the following kb article. KB2144949
Step #3
The custom cert files that need to be renamed on the nodes are located at /storage/vcops/user/conf/ssl. This should be completed on all nodes. Alternatively, you can remove them, but renaming them is sufficient.
# mv customCert.pem customCert.pem.BAK
# mv customChain.pem customChain.pem.BAK
# mv customKey.pem customKey.pem.BAK
# mv uploaded_cert.pem uploaded_cert.pem.BAK
Step #4
Now attempt to add the new node again. From the master node, you can watch the installation of the new node by tailing the casa.log
# tail -f /storage/vcops/log/casa/casa.log
Delete the snapshots as soon as possible.
_________________________________________________________________
Alternative Solutions
There is a known issue when upgrading the NSX host VIB from 6.1.X to 6.2.4, where once the host is upgraded to VIB 6.2.4, and the virtual machines are moved to it, if they should somehow find their way back to a 6.1.X host, the VM’s NIC will become disconnected causing an outage. This has been outlined in KB2146171
We found the following steps to be the best solution in getting to the 6.2.4 NSX VIB version on ESXi 6u2, without causing any interruptions in regards to the network connectivity of the virtual machines.
Get-VM -Location "<sourcehost>" | Move-VM -Destination (Get-Vmhost "<destinationhost>")
9. Once the host is fully evacuated, place the host in maintenance mode, and reboot it.
10. VMware provided us with a script that should ONLY be executed against NSX vib 6.2.4 hosts, and does the following:
I have attached a ZIP file containg the script here: fix_exportversion.zip
./vmfs/volumes/<Shared_Datastore>/fix_exportversion.sh /vmfs/volumes/<Shared_Datastore>/vsipioctl
Example output:
~ # /vmfs/volumes/NFS-101/fix_exportversion.sh /vmfs/volumes/NFS-101/vsipioctl
Fixed filter nic-39377-eth0-vmware-sfw.2 export version to 4.
Fixed filter nic-48385-eth0-vmware-sfw.2 export version to 4.
Filter nic-50077-eth0-vmware-sfw.2 already has export version 4.
Filter nic-52913-eth0-vmware-sfw.2 already has export version 4.
Filter nic-53498-eth0-vmware-sfw.2 has export version 3, no changes required.
Note: If the export version for any VM vNIC shows up as ‘2’, the script will modify the version to ‘4’ and does not modify other VMs where export version is not ‘2’.
11. Repeat steps 5 – 10 on all hosts in the cluster until completion. This script appears to be necessary as we have seen cases where a VM may still lose its NIC even if it is vmotioned from one NSX vib 6.2.4 host to another 6.2.4 host.
12. Once 6.2.4 host VIB installation is complete, and the script has been run against the hosts and virtual machines running on them, DRS can be set back to your desired setting like Fully automated for instance.
13. Virtual machines should now be able to vmotion between hosts without losing their NICs.
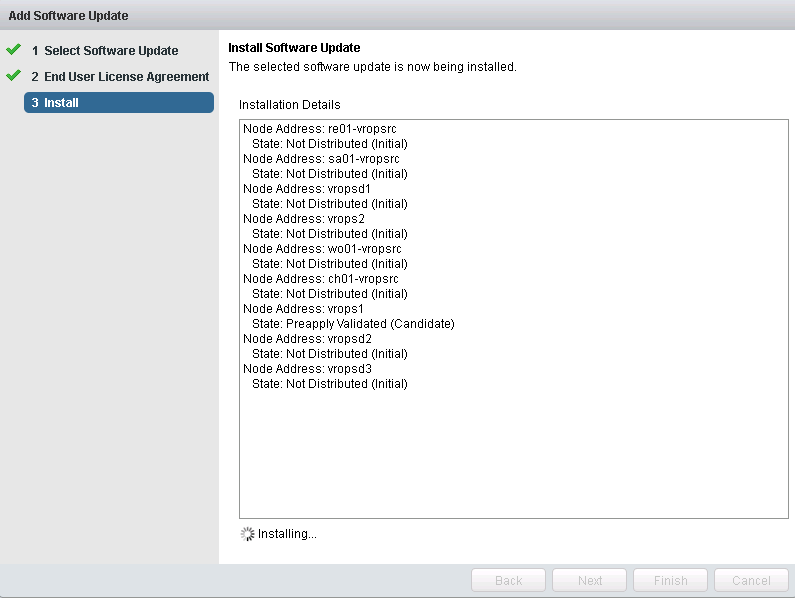
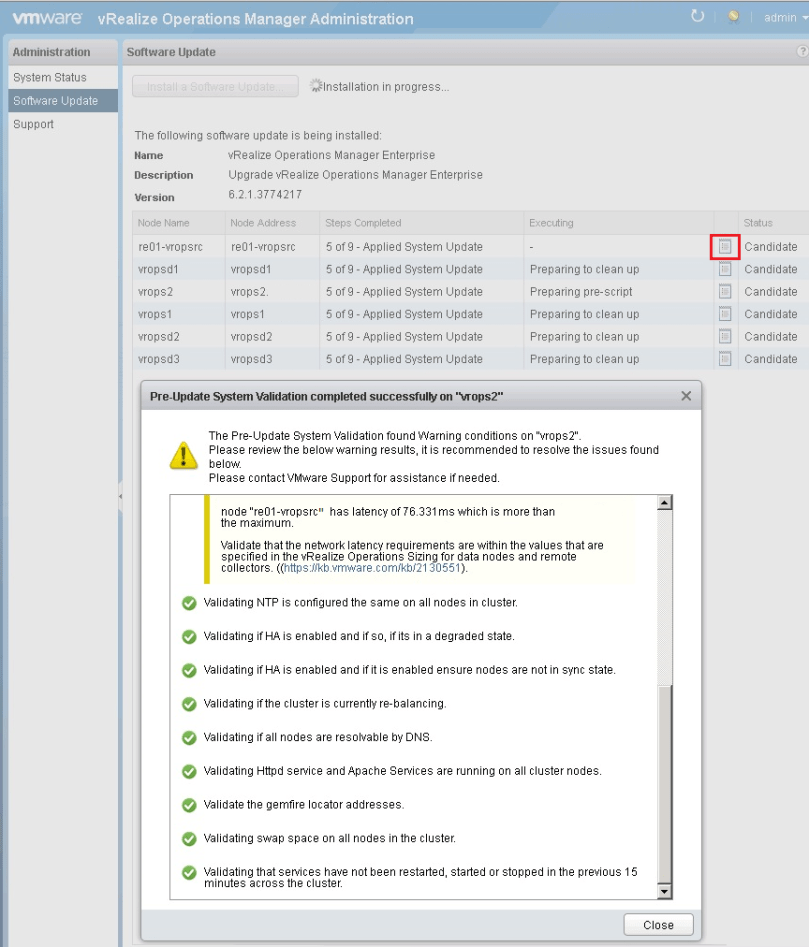
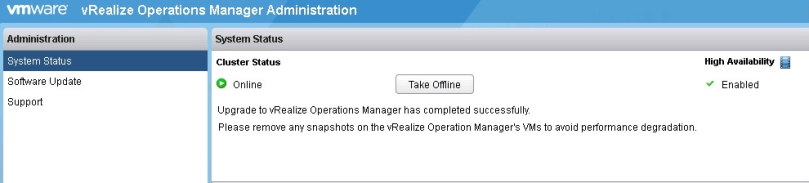
Upgrading a multi-node vROps cluster can bring significant downtime to the monitoring/data collection abilities of the cluster. The largest production cluster I am responsible for consists of nine data nodes, including the master and master replica, and four remote collectors for our remote data centers. If you recall my previous post Sizing and Installing The vROps Appliance, I discussed the various sizing options of a vROps cluster based on the data collected, and in my case this cluster is configured as LARGE due to the size of our vROps cluster. One of the biggest challenges of maintaining a large cluster, that has remote collectors collecting from data centers in different geographical locations, is the ability to upgrade the cluster with minimal downtime. As it stands now, if I were to upgrade this cluster with the traditional methods VMware provided, I would be looking at a minimal downtime of eight hours. VMware does offer a useful work around: How to reduce update time by pre-copying software update PAK files KB2127895, and we will be using that here.
But first, I wanted to introduce you to a script developed by a Jeremy McCoy, and his repository over at github called nakedhitman. In there you will find this awesome script called vROps Cluster Repair that I have personally used many times, and was recommended to me by VMware’s GSS. This script is intended to bring the vROps cluster back to a known healthy state, and I like to run it before upgrading my Production vROps clusters. You will want to familiarize yourself with that script, download and get it setup with your environment details.
# tail -f /storage/vcops/log/pakManager/vcopsPakManager.root.apply_system_update.log
–and–
# tail -f /storage/vcops/log/pakManager/vcopsPakManager.root.query.log
As a side note…
I have submitted a couple feature requests to VMware in order to ease the upgrade process of large vROps installations.
Came across an interesting error the other night while on call, as I had a host in a cluster that VM’s could not vMotion off of either manually or through DRS. I was seeing the following error message in vSphere:
The source detected that the destination failed to resume.
vMotion migration [-1062731518:1481069780557682] failed: remote host <192.168.1.2> failed with status Failure.
vMotion migration [-1062731518:1481069780557682] failed to asynchronously receive and apply state from the remote host: Failure.
Failed waiting for data. Error 195887105. Failure.
2016-12-09T19:44:40.373Z warning hostd[2B3E0B70] [Originator@6876 sub=Libs] ResourceGroup: failed to instantiate group with id: -591724635. Sysinfo error on operation return ed status : Not found. Please see the VMkernel log for detailed error information
2016-12-09T19:44:34.330Z info hostd[33481B70] [Originator@6876 sub=Snmpsvc] ReportVMs: processing vm 223
2016-12-09T19:44:34.330Z info hostd[33481B70] [Originator@6876 sub=Snmpsvc] ReportVMs: serialized 36 out of 36 vms
2016-12-09T19:44:34.330Z info hostd[33481B70] [Originator@6876 sub=Snmpsvc] GenerateFullReport: report file /tmp/.vm-report.xml generated, size 915 bytes.
2016-12-09T19:44:34.330Z info hostd[33481B70] [Originator@6876 sub=Snmpsvc] PublishReport: file /tmp/.vm-report.xml published as /tmp/vm-report.xml
2016-12-09T19:44:34.330Z info hostd[33481B70] [Originator@6876 sub=Snmpsvc] NotifyAgent: write(33, /var/run/snmp.ctl, V) 1 bytes to snmpd
2016-12-09T19:44:34.330Z info hostd[33481B70] [Originator@6876 sub=Snmpsvc] GenerateFullReport: notified snmpd to update vm cache
2016-12-09T19:44:34.330Z info hostd[33481B70] [Originator@6876 sub=Snmpsvc] DoReport: VM Poll State cache - report completed ok
2016-12-09T19:44:40.317Z warning hostd[33081B70] [Originator@6876 sub=Libs] ResourceGroup: failed to instantiate group with id: 727017570. Sysinfo error on operation returne d status : Not found. Please see the VMkernel log for detailed error information
2016-12-09T19:44:22.000Z cpu21:35086 opID=b5686da8)World: 15516: VC opID AA8C46D5-0001C9C0-81-91-cb-a544 maps to vmkernel opID b5686da8
2016-12-09T19:44:22.000Z cpu21:35086 opID=b5686da8)Config: 681: "SIOControlFlag2" = 1, Old Value: 0, (Status: 0x0)
2016-12-09T19:44:22.261Z cpu21:579860616)World: vm 579827968: 1647: Starting world vmm0:oats-agent-2_(e00c5327-1d72-4aac-bc5e-81a10120a68b) of type 8
2016-12-09T19:44:22.261Z cpu21:579860616)Sched: vm 579827968: 6500: Adding world 'vmm0:oats-agent-2_(e00c5327-1d72-4aac-bc5e-81a10120a68b)', group 'host/user/pool34', cpu: shares=-3 min=0 minLimit=-1 max=4000, mem: shares=-3 min=0 minLimit=-1 max=1048576
2016-12-09T19:44:22.261Z cpu21:579860616)Sched: vm 579827968: 6515: renamed group 5022126293 to vm.579860616
2016-12-09T19:44:22.261Z cpu21:579860616)Sched: vm 579827968: 6532: group 5022126293 is located under group 5022124087
2016-12-09T19:44:22.264Z cpu21:579860616)MemSched: vm 579860616: 8112: extended swap to 46883 pgs
2016-12-09T19:44:22.290Z cpu20:579860616)Migrate: vm 579827968: 3385: Setting VMOTION info: Dest ts = 1481312661276391, src ip = <192.168.1.2> dest ip = <192.168.1.17> Dest wid = 0 using SHARED swap
2016-12-09T19:44:22.293Z cpu20:579860616)Hbr: 3394: Migration start received (worldID=579827968) (migrateType=1) (event=0) (isSource=0) (sharedConfig=1)
2016-12-09T19:44:22.332Z cpu0:33670)MigrateNet: vm 33670: 2997: Accepted connection from <::ffff:192.168.1.2>
2016-12-09T19:44:22.332Z cpu0:33670)MigrateNet: vm 33670: 3049: data socket size 0 is less than config option 562140
2016-12-09T19:44:22.332Z cpu0:33670)MigrateNet: vm 33670: 3085: dataSocket 0x430610ecaba0 receive buffer size is 562140
2016-12-09T19:44:22.332Z cpu0:33670)MigrateNet: vm 33670: 2997: Accepted connection from <::ffff:192.168.1.2>
2016-12-09T19:44:22.332Z cpu0:33670)MigrateNet: vm 33670: 3049: data socket size 0 is less than config option 562140
2016-12-09T19:44:22.332Z cpu0:33670)MigrateNet: vm 33670: 3085: dataSocket 0x4306110fab70 receive buffer size is 562140
2016-12-09T19:44:22.332Z cpu0:33670)VMotionUtil: 3995: 1481312661276391 D: Stream connection 1 added.
2016-12-09T19:44:24.416Z cpu1:32854)elxnet: elxnet_allocQueueWithAttr:4255: [vmnic0] RxQ, QueueIDVal:2
2016-12-09T19:44:24.416Z cpu1:32854)elxnet: elxnet_startQueue:4383: [vmnic0] RxQ, QueueIDVal:2
2016-12-09T19:44:24.985Z cpu12:579860756)VMotionRecv: 658: 1481312661276391 D: Estimated network bandwidth 471.341 MB/s during pre-copy
2016-12-09T19:44:24.994Z cpu4:579860755)VMotionSend: 4953: 1481312661276391 D: Failed to receive state for message type 1: Failure
2016-12-09T19:44:24.994Z cpu4:579860755)WARNING: VMotionSend: 3979: 1481312661276391 D: failed to asynchronously receive and apply state from the remote host: Failure.
2016-12-09T19:44:24.994Z cpu4:579860755)WARNING: Migrate: 270: 1481312661276391 D: Failed: Failure (0xbad0001) @0x4180324c6786
2016-12-09T19:44:24.994Z cpu4:579860755)WARNING: VMotionUtil: 6267: 1481312661276391 D: timed out waiting 0 ms to transmit data.
2016-12-09T19:44:24.994Z cpu4:579860755)WARNING: VMotionSend: 688: 1481312661276391 D: (9-0x43ba40001a98) failed to receive 72/72 bytes from the remote host <192.168.1.2>: Timeout
2016-12-09T19:44:24.998Z cpu4:579860616)WARNING: Migrate: 5454: 1481312661276391 D: Migration considered a failure by the VMX. It is most likely a timeout, but check the VMX log for the true error.
We are using the vSphere distributed switch in our environment, and each host has a vmk dedicated to vMotion traffic only, so this was my first test, verified the IP and subnet for the vmk on the source/destination hosts, and I was successfully able to ping using vmkping to the destination host, and tested the connection both ways.
The second test completed was to power off a VM, and test its ability to vMotion off of the host – this worked. When I powered the VM back on it immediately went back to the source host. I then tried to vMotion the VM again while it was powered on from the affected source host, and move it to the destination host like I had before, and to my surprise it worked now. Tested this process with a few other VMs for consistency. I tried to restart a VM on the affected host, and then move it off to another host, but this did not work.
My final test was to vMotion a VM from a different host to the affected host. This worked as well, and I was even able to vMotion off from that affected host again.
In our environment we have a Trend-micro agent VM and a GI VM running on each host. I logged into the vSphere web-client to look at the status of the Trend-micro VM and there was no indication of an error, I found the same status checking the GI vm.
Knowing we have had issues with Trend-micro in the past, I powered down the Trend-micro VM running on the host, and attempted a manual vMotion of a test VM I knew couldn’t move before – IT WORKED. Tried another with the same result. Put the host into maintenance mode to try and evacuate the rest of the customer VMs off from it with success!
To wrap all of this up, the Trend-micro agent VM running on the esxi6 host was preventing other VMs from vMotioning off either manually or through DRS. Once the trend-micro agent VM was powered off, I was able to evacuate the host.
This post is not intended to be the traditional front-end health check on the appliance, and instead will focus on the back-end, specifically the Cassandra database on the data nodes. I decided to write this post due to the various issues I have encountered managing two large production deployments, with the largest containing 9 data nodes, and 3 remote collectors collecting and processing metrics north of 3,829,804.
The first check we can do is on the database sync between the data nodes including the master and master replica. This can also be useful in determining unusual disk growth on one or more of the data nodes. Open a SSH session to the master appliance and issue the following command:
# $VMWARE_PYTHON_BIN/usr/lib/vmware-vcops/tools/vrops-platform-cli/vrops-platform-cli.py getShardStateMappingInfo
The sample output to be concerned with looks similar to the following example:
{
   "stateMappings": {
    "vrops1": {
      "vRealize Ops Shard-0724c812-9def-4391-9efa-2395d701d43e": {
        "state": "SYNCHING"
      },
      "vRealize Ops Shard-77839361-986c-4817-bbb3-e7f4f1827921": {
        "state": "SYNCHING"
      },
      "vRealize Ops Shard-8469fdff-55f0-49f7-a0e7-18cd6cc288c0": {
        "state": "RUNNING"
      },
      "vRealize Ops Shard-8c8d1ce4-36a5-4f23-b77d-29b839156383": {
        "state": "RUNNING"
      },
      "vRealize Ops Shard-ab79572e-6372-48d2-990d-d21c884b46fb": {
        "state": "RUNNING"
      },
      "vRealize Ops Shard-bfa03b9e-bac9-4040-b1a8-1fd8c2797a6a": {
        "state": "OUT_OF_SYNC"
      }
    }
  },
The “vRealize Ops Shard” refers to the data nodes including the master and master replica nodes. The available status’ are RUNNING, SYNCHING, BALANCING, OUT_OF_BALANCE, and OUT_OF_SYNC.
The vRealize Operations Manager appliance uses Apache Cassandra database, so with this next command, we will be looking at the database load using a Cassandra utility called node tool. This command is only gathering operational statistics from the database, so it is safe to run as we are not making any system changes here.
# $VCOPS_BASE/cassandra/apache-cassandra-2.1.8/bin/nodetool --port 9008 status
This will return output similar to:
Datacenter: datacenter1
=======================
Status=Up/Down
|/ State=Normal/Leaving/Joining/Moving
--   Address    Load    Tokens  Owns  Host ID                               Rack
UN   192.2.3.6  80.08 GB  256     ?   232f646b-3fbc-4388-8962-34000c1bb48b  rack1
UN   192.2.3.7  80.53 GB  256     ?   1bfec59b-3ba8-4ca0-942f-5bb2f97b7319  rack1
UN   192.2.3.4  80.11 GB  256     ?   da6c672c-cc69-4284-a8f5-2775441bb113  rack1
UN   192.2.3.5  79.33 GB  256     ?   ee4a3c3f-3f0f-46ac-b331-a816e8eb37c5  rack1
DN   192.2.3.3  75.13 GB  256     ?   19e80237-6f2c-4ff6-881e-ce94870e0ca5  rack1

Note: Non-system keyspaces don't have the same replication settings,
effective ownership information is meaningless
———————————————————————–
Concerning the database load, In most cases from my experience GSS would need to truncate the activity, results, and queueid tables, and then run a parallel nodetool repair command on all data nodes starting with the master in order to get the appliance’s feet back under it. I will detail those steps here as these are the steps usually performed:
# service vmware-vcops stop analytics
4. Repair the RESORUCE_STATE_DELETE flags for non-existing resources that are to be deleted:
# su - postgres -c "/opt/vmware/vpostgres/current/bin/psql -d vcopsdb -p 5433 -c \"update resource set resource_flag='RESOURCE_STATE_NORMAL' where resource_flag='RESOURCE_STATE_DELETE';\""
5. Perform Cassandra maintenance on the master node only. Afterword you will be running cassandra repair on the rest of the nodes that will sync up their databases with the master. There are a total of four commands here, so run them in order:
# $VCOPS_BASE/cassandra/apache-cassandra-2.1.8/bin/cqlsh --ssl --cqlshrc $VCOPS_BASE/user/conf/cassandra/cqlshrc -e "consistency quorum; truncate globalpersistence.activity_tbl"
# $VCOPS_BASE/cassandra/apache-cassandra-2.1.8/bin/cqlsh --ssl --cqlshrc $VCOPS_BASE/user/conf/cassandra/cqlshrc -e "consistency quorum; truncate globalpersistence.activityresults_tbl"
# $VCOPS_BASE/cassandra/apache-cassandra-2.1.8/bin/cqlsh --ssl --cqlshrc $VCOPS_BASE/user/conf/cassandra/cqlshrc -e "consistency quorum; truncate globalpersistence.queueid_tbl"
# $VCOPS_BASE/cassandra/apache-cassandra-2.1.8/bin/nodetool -p 9008 clearsnapshot
6. Perform Cassandra maintenance on all nodes:
# $VCOPS_BASE/cassandra/apache-cassandra-2.1.8/bin/nodetool -p 9008 repair -par -pr
7. To monitor the repair progress, you can start another SSH session to the master node and tail the following log:
# tail -f /storage/log/vcops/log/cassandra/system.log
Generally speaking, you can also monitor the nodetool repair operation with these two nodetool commands, but this is not necessary:
# $VCOPS_BASE/cassandra/apache-cassandra-2.1.8/bin/nodetool --port 9008 netstats
# $VCOPS_BASE/cassandra/apache-cassandra-2.1.8/bin/nodetool --port 9008 compactionstats
8. Perform the instance metric key id clean-up on all nodes. Perform this step in parallel on the master and data nodes. This cleans up the disk on the nodes, as this cleans up the snapshots of Cassandra on each node:
# $VMWARE_PYTHON_BIN $VCOPS_BASE/tools/persistenceTool.py RemoveMatchedMetricKeys --outputFile /tmp/deleted_report.txt --regex "\"^diskspace-waste:.+?snapshot:.*\"" --remove true # $VMWARE_PYTHON_BIN $VCOPS_BASE/tools/persistenceTool.py RemoveMatchedMetricKeys --outputFile /tmp/deleted_report2.txt --regex "\"^diskspace:.+?snapshot:.*(accessTime|used)$\"" --remove true
9. Clean up the alarms & alerts on all nodes. Perform this step in parallel on the master and data nodes:
# su - postgres -c "/opt/vmware/vpostgres/9.3/bin/psql -p 5432 -U vcops -d vcopsdb -c 'truncate table alert cascade;'"
# su - postgres -c "/opt/vmware/vpostgres/9.3/bin/psql -p 5432 -U vcops -d vcopsdb -c 'truncate table alarm cascade;'"
10. Bring the analytics processes back online. Execute this step on the master, master replica and data nodes. You may use a ssh for-loop and execute these commands sequentially:
# service vmware-vcops start analytics
11. Once the cluster is fully online and you can confirm the data is being collected, delete the snapshots you took earlier.
12. On the master node, if you again run the command:
# $VMWARE_PYTHON_BIN/usr/lib/vmware-vcops/tools/vrops-platform-cli/vrops-platform-cli.py getShardStateMappingInfo
You should see something similar to:
{
   "stateMappings": {
    "vrops1": {
      "vRealize Ops Shard-0724c812-9def-4391-9efa-2395d701d43e": {
        "state": "SYNCHING"
      },
      "vRealize Ops Shard-77839361-986c-4817-bbb3-e7f4f1827921": {
        "state": "SYNCHING"
      },
      "vRealize Ops Shard-8469fdff-55f0-49f7-a0e7-18cd6cc288c0": {
        "state": "RUNNING"
      },
      "vRealize Ops Shard-8c8d1ce4-36a5-4f23-b77d-29b839156383": {
        "state": "SYNCHING"
      },
      "vRealize Ops Shard-ab79572e-6372-48d2-990d-d21c884b46fb": {
        "state": "SYNCHING"
      },
      "vRealize Ops Shard-bfa03b9e-bac9-4040-b1a8-1fd8c2797a6a": {
        "state": "SYNCHING"
      }
    }
  },
13. On the master node, if you again run the nodetool status command
# $VCOPS_BASE/cassandra/apache-cassandra-2.1.8/bin/nodetool --port 9008 status
You should see something similar to:
Datacenter: datacenter1
=======================
Status=Up/Down
|/ State=Normal/Leaving/Joining/Moving
--   Address    Load    Tokens  Owns  Host ID                               Rack
UN   192.2.3.6  120.20 MB  256     ?   232f646b-3fbc-4388-8962-34000c1bb48b  rack1
UN   192.2.3.7  128.20 MB  256     ?   1bfec59b-3ba8-4ca0-942f-5bb2f97b7319  rack1
UN   192.2.3.4  120.11 MB  256     ?   da6c672c-cc69-4284-a8f5-2775441bb113  rack1
UN   192.2.3.5  115.33 MB  256     ?   ee4a3c3f-3f0f-46ac-b331-a816e8eb37c5  rack1
DN   192.2.3.3  128.13 MB  256     ?   19e80237-6f2c-4ff6-881e-ce94870e0ca5  rack1

Note: Non-system keyspaces don't have the same replication settings,
effective ownership information is meaningless
14. Log into the regular web interface and edit the policy to stop collections on snapshot metrics. This will help in overall performance going forward.
Creating policies in VMware’s vRealize Operations Appliance can be strait forward, if there is a decent understanding of every platform it’s monitoring. In my last post of this series, I covered the creation of object groups, and that post is important here because policies can be created and assigned to those object groups, allowing the tuning of alerts received for those groups.
Once logged in to the vROps appliance, go into the administration section, and there you will find the policies.
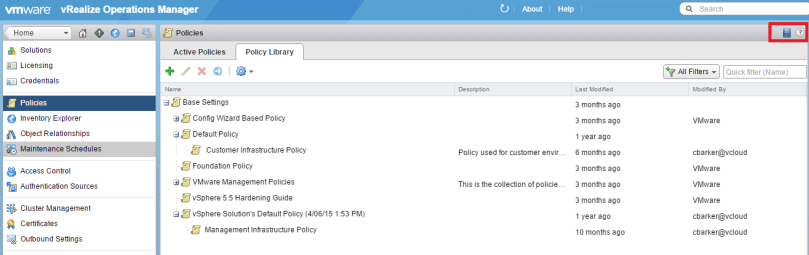
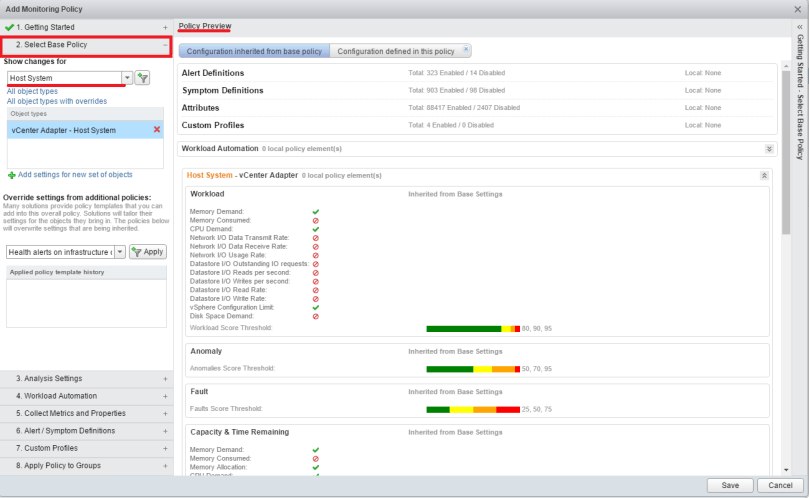
To create a new policy click on the green plus sign to get started. Give the policy a unique name, and it would be good practice to give a description of what the policy is intended to do. When creating a policy, you have the ability to “start with” a VMware pre-defined policy, and I recommend taking advantage of that until there is a firm understanding of what these policies do.
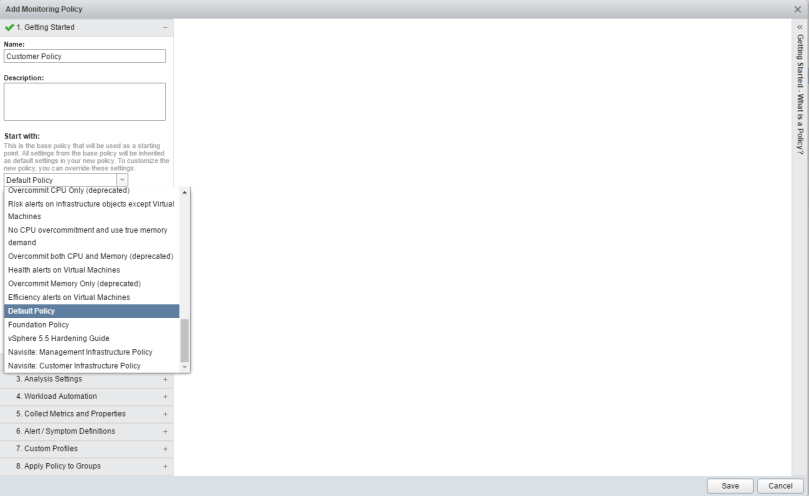
On the Select Base Policy tab, you can use the drop down menu on the left to get a policy overview of what is being monitored. In this example, Host system was selected.
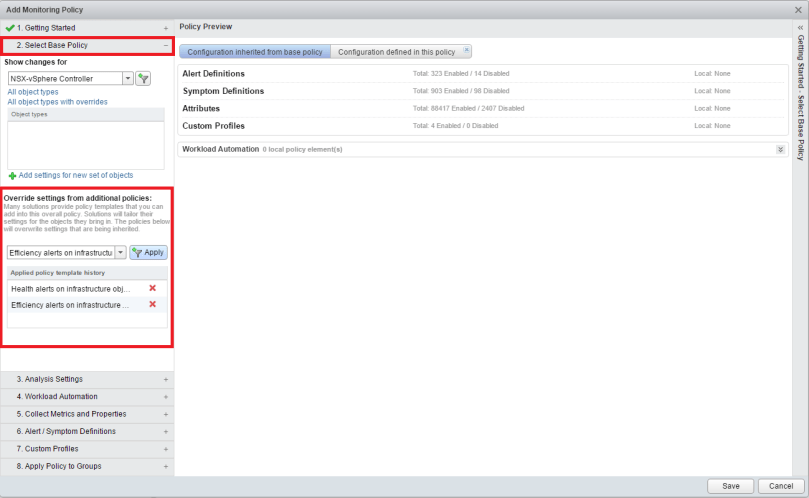
Policy Overrides can also be incorporated into this policy. In other words, if there are certain alerts that you do not want, one of the pre-defined policies may already have those alerts turned off, so those policies can be added to the new policy being created here. Work smarter, not harder right?
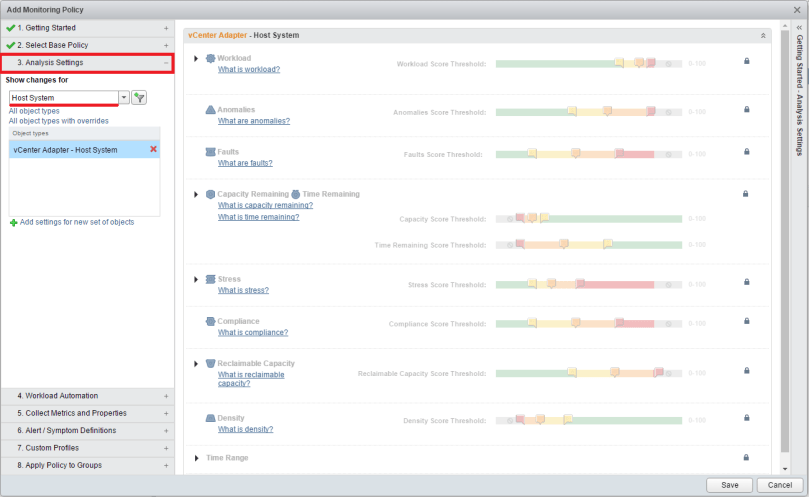
Moving along to the Analysis Settings tab, here you can see how vROps analyses the alerts, determines thresholds, and assigned system badges. These can be left at their current settings per the policy you are building off of, or you can click on the padlock to the right and make individual changes. Keep in mind under the “Show changes for” drop down menu, you will have many objects to select to change the analysis settings on.
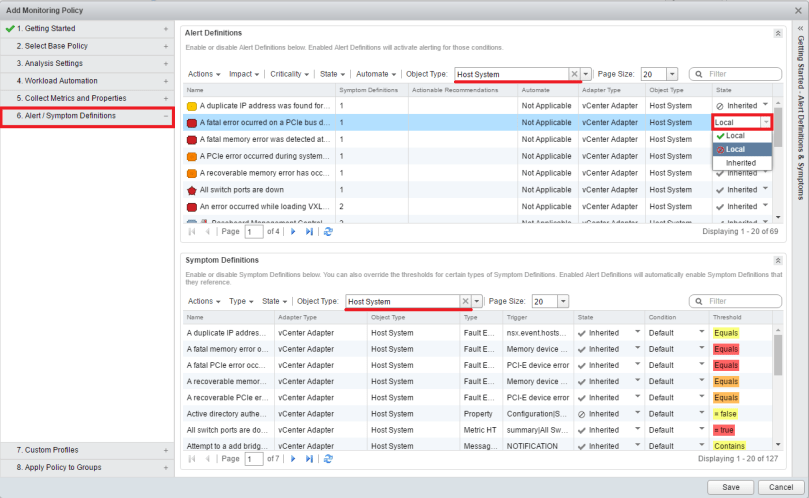
The Alert/Systems Definitions tab is probably where the majority of time will be spent. The “Alert Definitions” box at the top is where alerts can be turned on or off based on the base policy used to create this one, or the override policies used.
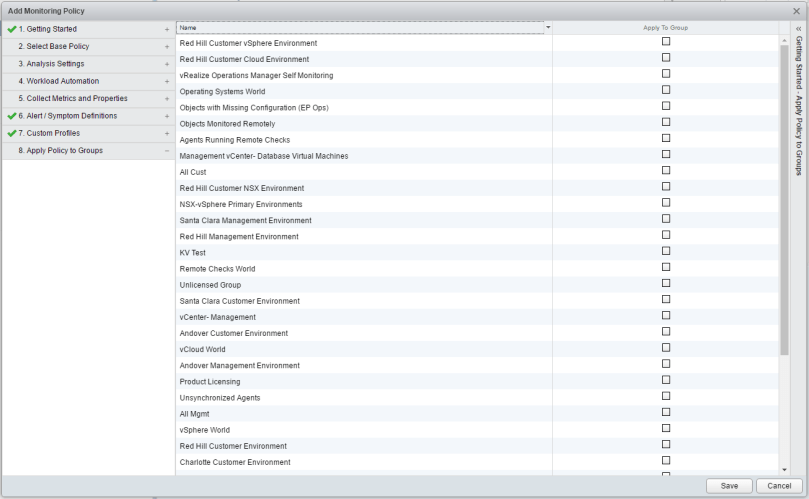
Finally, you can apply the policy to the custom groups you created before in the Apply Policy to Groups tab.
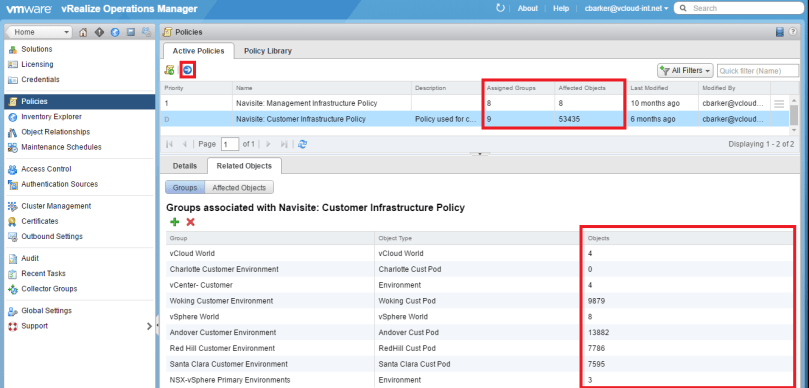
Once you click save, and go back to the Active Policies tab, you will be able to see the new policy created, and within five minutes, you should see the Affected Objects count rise. You can see here that I have a policy marked with “D” meaning it is the default appliance policy. You can set your own policy as default by clicking the blue circle icon with the arrow on the upper left side. It may take up to 24 hours before the active alert page reflects the settings of the new policy. Otherwise you can manually clear those alerts.
Previous post to this series: Configuring VMware vRealize Operations Manager Object Groups

You must be logged in to post a comment.