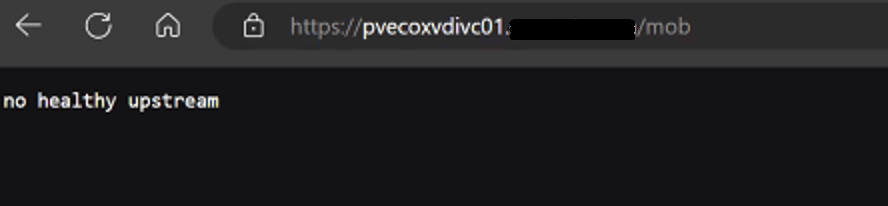
One of my customers had a strange issue where the vCenter MOB wasn’t working on some of their vCenters in their VMware Cloud Foundation 4.X deployment.
The 10 vCenters are running in enhanced linked mode, and out of the 10, we only had one management vCenter where the MOB was working. All other services on the vCenter appear to be working fine.
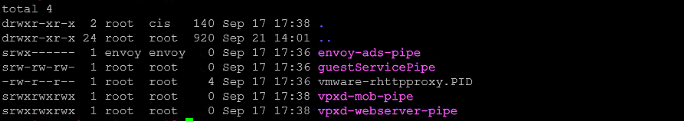
On the vCenter, we can check and see if the vpxd-mob-pipe is listed in the following directory /var/run/vmware with the following command:
ls -la /var/run/vmware/
If we do not see vpxd-mob-pipe, then we need to look at the vpxd.cfg file. Specifically we are looking for the following parameter: <enableDebugBrowse>. If this is set to false, the MOB will not work.
vi /etc/vmware-vpx/vpxd.cfg
Once the vpxd.cfg opens, we can search the file by pressing the ‘ / ‘ key, and then enter:
/<enableDebugBrowse>
and then press enter.
This should take us to where we need to be. In my case, it was set to false as shown below:
<enableDebugBrowse>false</enableDebugBrowse>
Hit the ‘INSERT’ key, and change >false< to >true<.
<enableDebugBrowse>true</enableDebugBrowse>
Hit the ‘ESC’ key, and then hit the ‘ : ‘ key followed by entering ‘ wq! ‘ to save and exit the vpxd.cfg file.
:wq!
Now we need to stop and start the vmware-vpxd service with the following command:
Continuing from my previous blog post where the VMware Cloud Foundation 4.x SDDC manager was unable to obtain SSH connection to NSX Edges, we determined that at some point, the edges were redeployed via NSX-T instead of through the SDDC manager, and we had to update the edge ID’s in the SDDC manager database. I’d certainly recommend checking that blog out here –> VMware Cloud Foundation SDDC Manager Unable To Remediate Edge Admin and Audit Passwords. Part 1.
In this blog, I will go through the second issue where we identified the HostKey of the edges had been changed by investigating the logs, and the process we used to fix it and restore the SDDC manager’s communication with the edges, so that we can successfully manage them via the SDDC manager in VMware Cloud Foundation.
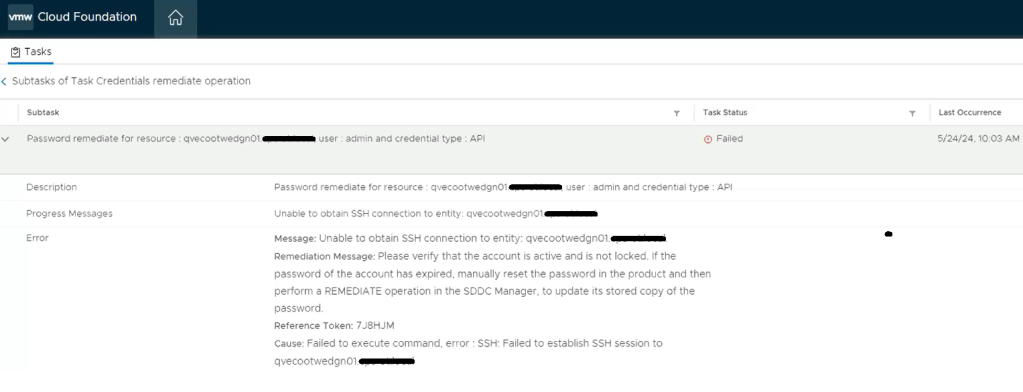
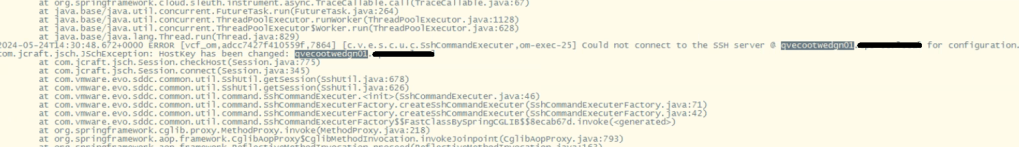
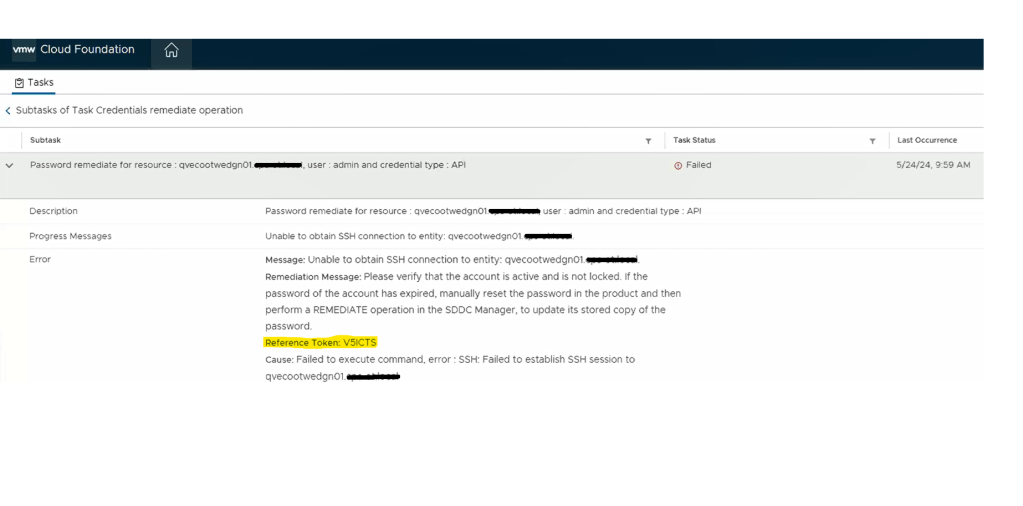
We still see a similar error message in the SDDC manager UI when we attempt to remediate the edges admin and audit passwords. We established an SSH session to the SDDC manager to review the operationsmanager.log located in /var/log/vmware/vcf/. We did a “less operationsmanager.log” and searched for the edge, in this example “qvecootwedgen01”
After searching the log, we can see there’s an error in the operationsmanager.log that the HostKey has been changed. To resolve this issue, we can use a script called fix_known_hosts.sh. The fix_known_hosts.sh script was created by Laraib Kazi to address an issue where SSH attempts from the SDDC Manager fail with an error related to the HostKey. This script removes existing erroneous entries in the known_hosts files and updates them with new ones. It is recommended to take a snapshot of the SDDC Manager before executing the script, which edits 4 known_hosts files. This script is useful when dealing with SSH host key mismatches, which can occur due to various reasons like restoring from a backup, manual rebuild, or manual intervention to change the Host Key. The script can be downloaded from hist github page here.
Upload the script to a safe spot on the SDDC manager. You can put it in the /tmp directory, but remember it will be deleted on next reboot. The script can be run on the SDDC manager as is. HOWEVER, you will want to prep before hand, and get the FQDN of the edge node(s) and IP address(s) in a text file as we will need those when we run the script.
************************************************************************************************************** STOP… Before continuing, take an *offline* (powered off) snapshot of the SDDC manager VM as we will be updating the edgenode HostKey on the SDDC manager. **************************************************************************************************************
Disclaimer: While this process has worked for me in different customer environments, not all environments are the same, and your mileage may vary.
Run the script:
./fixed_known_hosts.sh
You’ll want to enter the FQDN of the nsx-t edge being fixed. The resulting example output should follow:
Re-run this script against additional NSX-T edges as needed.
Now you’re ready to try password operations again in the SDDC manager against the edge(s). If you elected to create a new password on the NSX-T edge, you’ll need to choose the password “remediation” option in the SDDC manager to update the database with the new password created. If you set the password on the NSX-T edge back to what the SDDC manager already had, then just use the password “rotate now” function.
SDDC password operations should now be working as expected. If this did not resolve the issue, I would revert back to snapshot, and contact support for further troubleshooting.
If this resolved your issue, don’t forget to clean your room, and delete any snapshots taken.
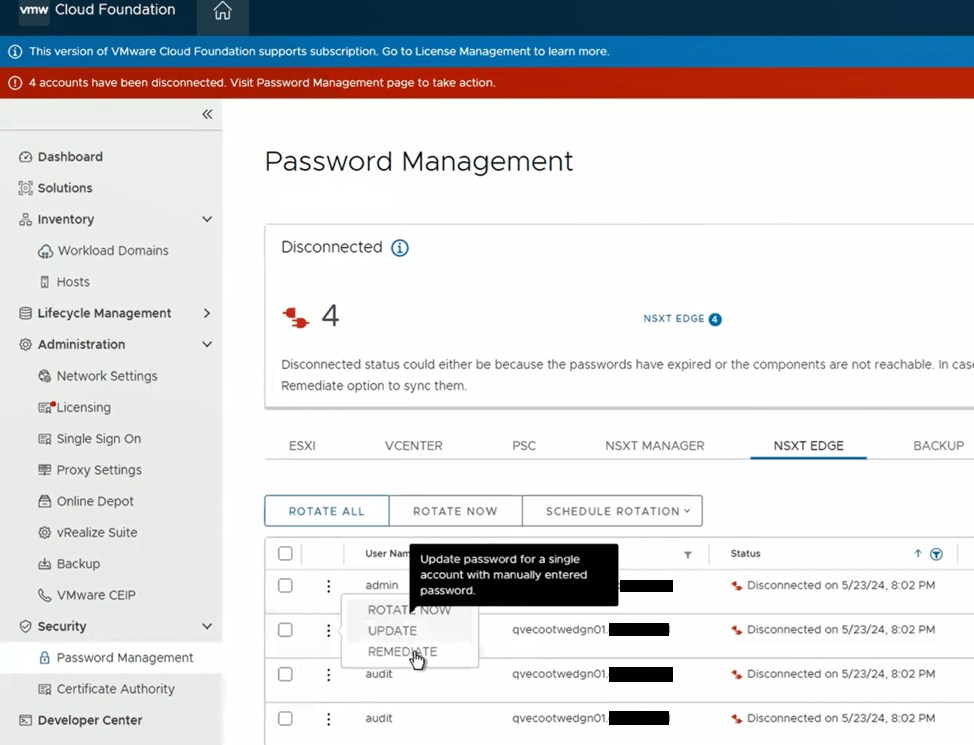
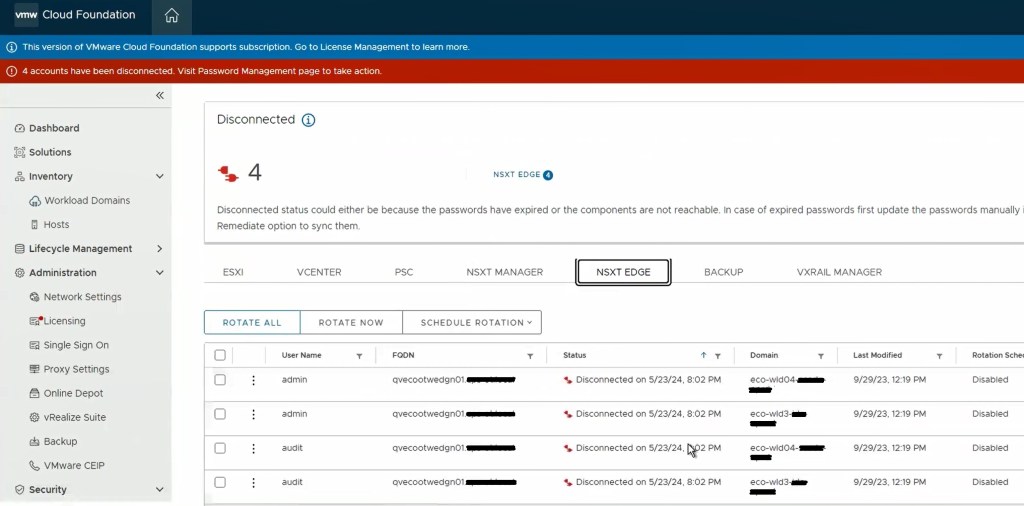
One of the cool features of VMware Cloud Foundation has, is the ability to manage VMware endpoint passwords from SDDC manager i.e.: NSX, edges, vCenter, ESXi hosts, and Aria Suite Lifecycle Manager. I wanted to share an experience I had on a recent VMware Cloud Foundation (VCF) 4.x project, where the NSX-T edge root, admin, and audit accounts expired and showed disconnected in SDDC manager.
I’ve decided to split this blog into two parts, because we ended up having two different issues. The first being that the edges, had been redeployed through NSX-T, and the second being a result of the first, that the known HostKey had changed for the edges.
Although we were able to remediate the root accounts on the edges, we could not remediate the admin and audit accounts.
Going back to the SDDC manager, we are now able to remediate and rotate the root account of the NSX-T edges. However, the admin and audit accounts won’t remediate and we see the following error displayed in the SDDC manager UI.
Digging deeper into the problem, we established an SSH session to the SDDC manager to review the operationsmanager.log located in /var/log/vmware/vcf/. We did a “less operationsmanager.log” and searched for the edge, in this example “qvecootwedgen01”. We found that the SSH connection could not be established due to the HostKey being changed.
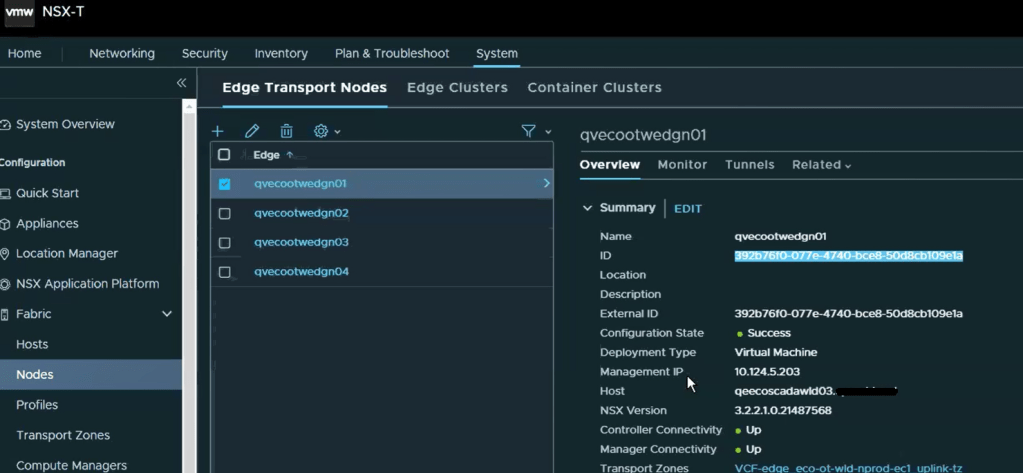
With this error message, we wanted to validate the edge IDs in the SDDC manager database, and compare those to the ones in the NSX-T manager, suspecting the edge IDs had changed likely to being redeployed directly through the NSX-T manager instead of the SDDC manager.
Looking in the NSX-T manager UI, we can get the edge node ID.
Copy the edge ID to a text file. Let’s compare that to what the SDDC manager has. SSH to the SDDC manager, and su root.
Run the following curl command to gather and output the NSX-T edge clusters to a json for review.
Now, let’s check the json output to compare the edge node ID. change directory to the tmp directory and do a less on the cluster.json.
less cluster.json
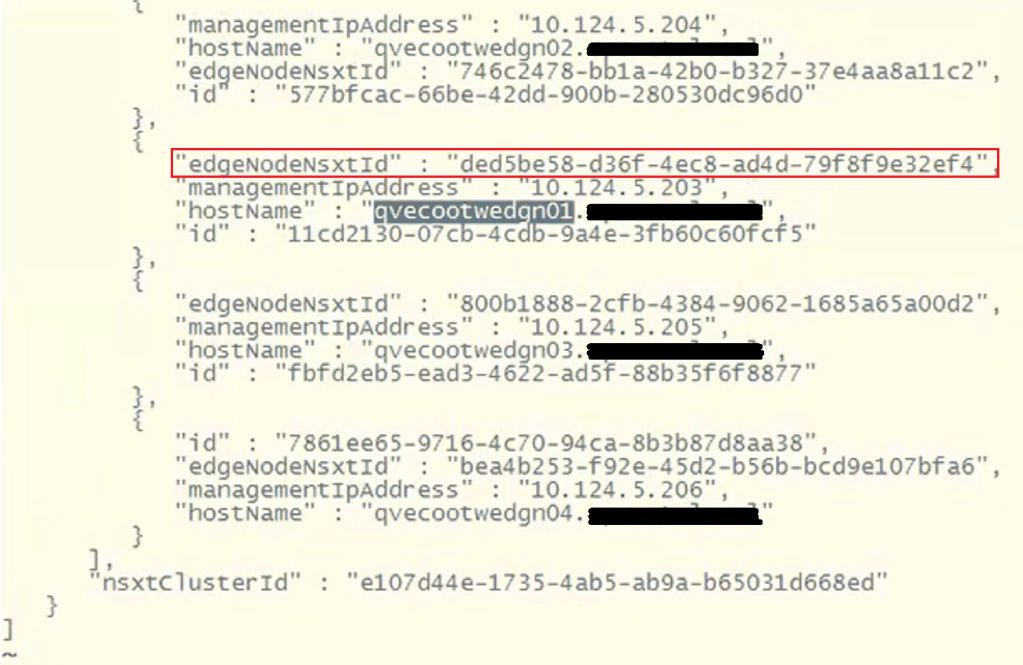
To find the edge node we are looking for, do a /<edgenode> and hit enter. For this example, we are looking for edge “qvecootwedge01”.
Looking at the “edgeNodeNsxtId” of the example edge qvecootwedge01, we can see the ID does not match what was found in NSX-T UI, which would be an indication the edge had been updated/redeployed at some point. This is one of the reasons why the edge shows disconnected in SDDC manager UI, and it needs to be corrected.
At this point, there’s enough evidence to contact support. However, after having been through this in VCF 4.x deployments, I have detailed steps here in this blog and the next, that I have used to resolve this issue. For those willing…. Grab a partner; we’ll be doing open heart surgery on the SDDC manager database…
************************************************************************************************************** STOP… Before continuing, take an *offline* (powered off) snapshot of the SDDC manager VM as we will be updating the edgenode ID (edgenodeNsxtId) in the SDDC manager database. **************************************************************************************************************
Disclaimer: While this process has worked for me in different customer environments, not all environments are the same, and your mileage may vary.
It’s important to note that we will not be interacting with the NSX-T edge node, and we are only updating the SDDC manager database. There’s no impact to the edge node traffic. There is always an associated risk with updating the SDDC manager database, which is the reason for the snapshot. We can always revert back to the snapshot and undo the change if needed.
Change to the tmp directory if not already there.
With the next command, we’ll be cloning the nsxt-edgecluster config into a cluster.json for us to modify for the purpose of updating the edgenodeNsxtId value of the edge, to match the ID that was in the NSX-T manager. Modify the following command and update with the FQDN of the SDDC appliance:
Now that we have a current export of the config, we’ll clone the config.json to a new file we will edit.
cp cluster.json cluster_fixed.json
Let’s edit the new cluster_fixed.json.
vi cluster_fixed.json
The contents of this json contain all of the NSX-T edge clusters for the particular NSX-T cluster. This may have more edge clusters or less depending on the deployment model chosen for VCF. Page Down until you find the desired edge cluster that needs to be updated.
Next, we’ll need to delete everything else in the json and only keep the desired edge cluster that needs to be updated, because we will eventually pass this json back to the SDDC manager, and this is the only way it will accept the updated edge IDs for the edges that are part of this cluster.
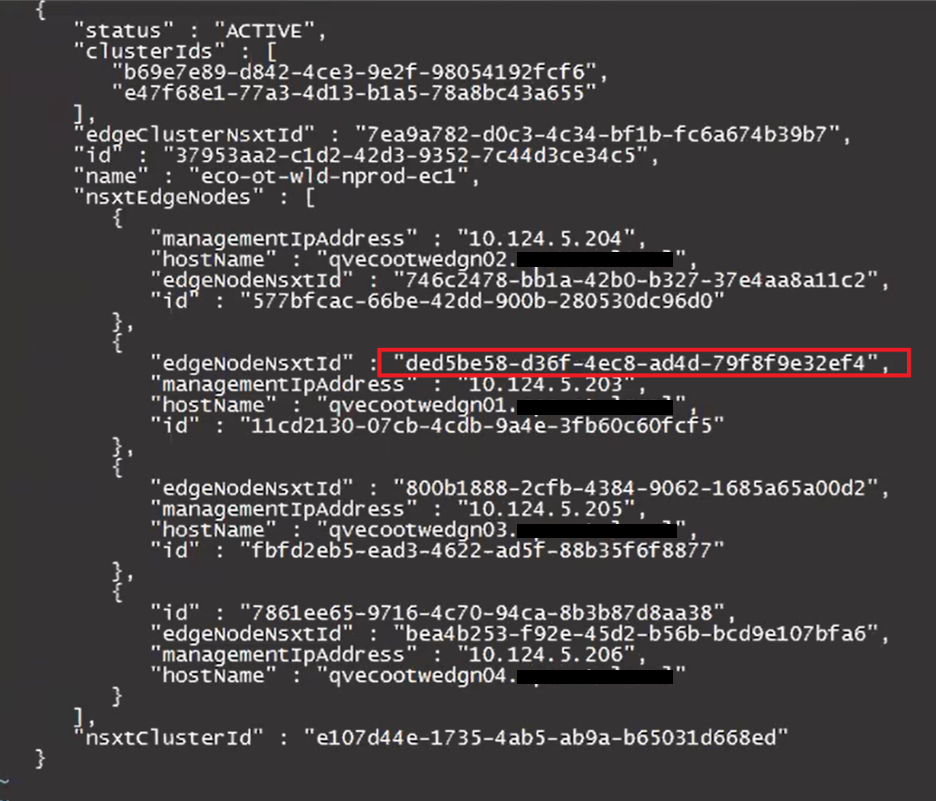
In this example, we are only keeping the config for the edge cluster “eco-ot-wld-nprod-ec1”. There will be a ‘ ] ‘ at the end of the json that will need to be deleted. The resulting json should look something like this.
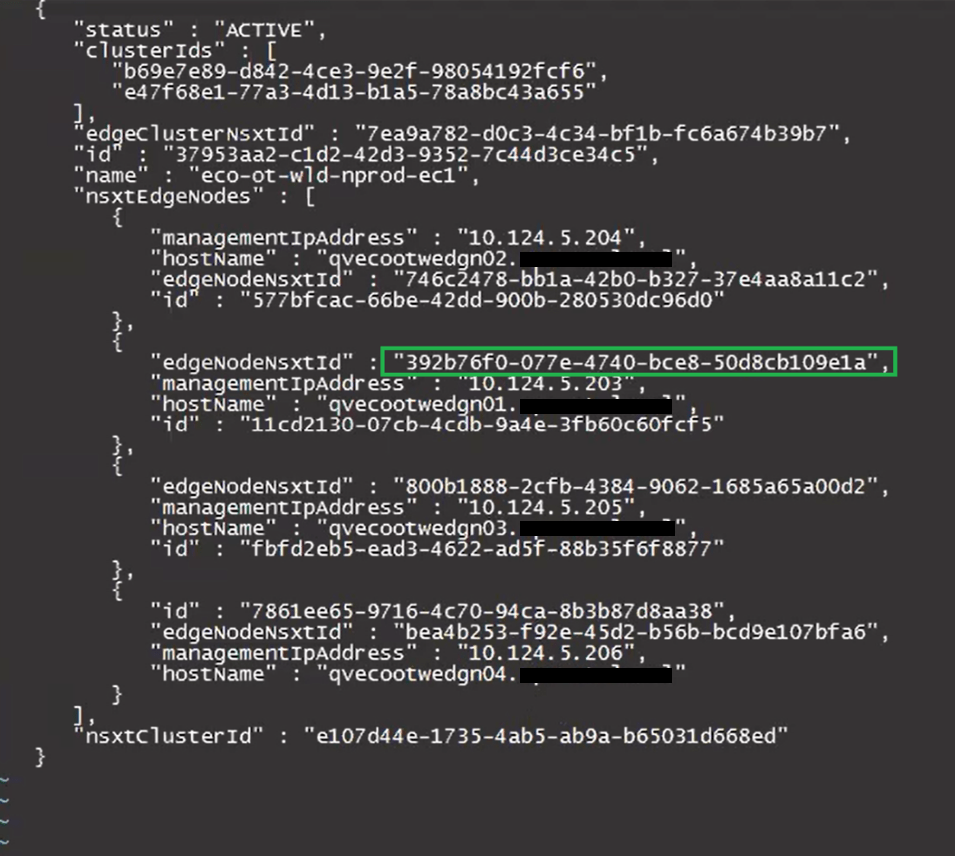
Update the desired “edgeNodeNsxtId”(s) with the desired ID(s) we got from the NSXT UI earlier.
Before:
After:
Keep the new edge ID handy, as we will need it for the curl command later on when we pass the updated cluster_fixed.json back to the SDDC manager.
Press ‘esc’. Enter ‘:wq’ to save the cluster_fixed.json.
Modify this curl command to update the SDDC manager host name where it says localhost, update the json name to replace test.json, and place the ID for the nsxT edge cluster at the end after the ‘/’.
curl -X PUT -H "Content-Type: application/json" --data @test.json http://localhost/inventory/nsxt-edgeclusters/
The updated curl command should look something like this example:
curl -X PUT -H "Content-Type: application/json" --data @cluster_fixed.json http://pvecootvcf01/inventory/nsxt-edgeclusters/37953aa2-c1d2-42d3-9352-7c44d3ce34c5
Paste the command into the terminal and hit enter to run. The output should be similar to this example:
You may need to repeat this process for additional edge IDs that need to be updated.
In this blog, I am going to share a problem I came across on a Professional Services engagement with a customer’s VMware Cloud Foundation 4.x environment, and our inability to remediate the root account of the NSX-T appliances.
Passwords had expired in the environment and showed disconnected in the SDDC manager UI. For the root, admin, and audit accounts, we were able to follow the following knowledge base article and get these accounts active on the NSX-T appliances: Credential operations fail on NSX Components in SDDC Manager. We tested these accounts and everything was working as expected on the appliances.
In the SDDC manager UI, we then were able to remediate and rotate the admin account for NSX-T appliances. However, while trying to remediate the root account with the known password that was already in the SDDC database, the operation failed. So we tried to create a brand new password for the root account on the NSX-T appliances, and then tried the to remediate the account again in the SDDC UI, but received the same error. “Failed to test: SSH credentials throughout the NSX-T cluster.”
Using the Reference Token from the failed task, I established an SSH connection to the SDDC appliance to review the operationsmanager log.
less /var/log/vmware/vcf/operationsmanager/operationsmanager.log
I then searched for the reference token “/OJB1CJ”, and found that the same error message given in the SDDC UI was given in the operationsmanager log. I was also finding javax.net.ssl.SSLHandshakeException error messages. I backed out of the log, and then validated that I could indeed SSH from the SDDC appliance to each of the NSX-T appliances, and that I could SSH from each of the NSX-T appliances back to the SDDC appliance, and validated that I could establish an SSH connection between each of the NSX-T appliances. Logging into the NSX-T UI, everything appeared to be happy and healthy. Lastly, I decided to check the self-signed certificates on each of the NSX-T appliances. NSX01 and NSX02 both looked proper, and had the correct FQDN for each, however, NSX03 appliance did not. Somehow it had the FQDN of the vip.
Suspecting it was the certificate on NSX03 that was hosing us, we used the VMware documentation to Replace Certificates of the NSX-T appliances with a signed certificate. We could NOT use the SDDC manager to replace the NSX-T certificates, because SDDC manager requires a good root account in order to use this automated function, and we could not fix the root account without having a proper certificates on the NSX-T appliances. We used one signed certificate across the three appliances and vip, and made sure the vip, NSX01, NSX02, and NSX03 were all in the SAN. We then validated that each NSX-T appliance had a healthy signed certificate with the padlock in the URL.
I went back to the SDDC manager UI, and was then able to successfully remediate the NSX-T root account for the workload domain. As previously mentioned above, we used Credential operations fail on NSX Components in SDDC Manager to set the accounts on the NSX-T cluster to match what the SDDC manager had, which is why we chose the password remediation option on the SDDC manager here. Now that we have validated that we have good NSX-T accounts in the SDDC manager, we now rotate the NSX-T cluster credentials so that new passwords will be generated.
In VMware Cloud Foundation 4.5.1, managing certificates of the Aria Suite LCM, NSX, VXRAIL, and vCenter Certificates should be done via the SDDC manager, so that it trusts the components certificate. The official documentation on how to do it can be found here -> Manage Certificates in a VMware Cloud Foundation.
In some cases however, certificates can be replaced/updated outside of the SDDC manager either due to a lack of understanding, or in emergency situations where certificates expired. In either of those situations, the certificate must be imported into the trusted root store on the SDDC manager appliance to re-establish trust to those components. Otherwise, SDDC manager will not function as intended.
To get straight to the punch, this is not supported yet. If you already have an existing VCF deployment, there currently is no supported way to migrate your workload domains to vLCM, per the support article here -> Transition from vSphere Lifecycle Manager Baselines to vSphere Lifecycle Manager Images is not supported with VMware Cloud Foundation. While you can technically use the vCenter UI / APIs to make the switch, it will cause workflows in SDDC manager to break, VMware support/engineering will have to get involved, and most likely the changes will have to be reverted.
If you are in the beginnings of deploying a new workload domain, by default it will use vSphere Lifecycle Manager baselines as the update method, unless you specifically checked “Manage clusters in this workload domain using baselines (deprecated)” during the workload domain deployment. However, this option would require you to have an existing vLCM image prior to the workload domain being deployed. If you don’t have a vLCM image yet, the VMware documentation suggests that you deploy the workload domain using legacy images (VUM), and that documentation can be found here -> Deploy a VI Workload Domain Using the SDDC Manager UI.
Doing a little research on the available options if no vLCM baseline image is available, and if you already have identical ESXi hosts deployed to the VCF environment, in vSphere, you can create a new empty compute cluster, select the option to manage the cluster with vLCM baselines, select a identical host already deployed to the environment to import and create the vLCM baseline from including the NSX driver. Now you have a vLCM baseline you can use for new workload domains and clusters using identical hosts. The new vLCM baseline can be imported into the SDDC manager. One might ask if it is safe to create a new compute cluster using the vSphere UI in a VCF deployment? For this purpose because it is temporary, the answer is yes. Technically, if you add additional compute clusters in vSphere without going through the SDDC manager, the SDDC will have no knowledge of it and won’t interact with it, so for our purposes, it is safe to create the empty compute cluster to create the new baseline, and then just delete the empty cluster when finished. Always remember to clean your room.
Although it will take a little work on the font end if you currently do not have vLCM baseline images to deploy a new workload domain, the above process can be used to create it. Eric Gray put together an excellent blog and YouTube video on this here -> Updating VCF Workload Domains deployed using vLCM Images. This walks us through the process of creating a new vLCM baseline image for a vLCM enabled workload domain to upgrade it, but the same process can be used to create a new vLCM image for a new workload domain with identical hardware.
If you have just deployed a workload domain and selected Manage clusters in this workload domain using baselines (deprecated) (legacy VUM), there is no way to convert it to vLCM baselines (at the time of writing this blog). You have to REDEPLOY the workload domain. You could however, take the opportunity using the above method to create a vLCM baseline image for the workload domain, so that when you redeploy it, you’ll have a vLCM image to use. Silver lining?
Unconfirmed reports indicate that the functionality to migrate existing workload domains from legacy VUM to vSphere Lifecycle Manager baselines is *targeted* for VMware Cloud Foundation 9.
One of my customers was interested in tracking datastore over-provisioning in Aria Operations, since they started deploying all of their virtual machines with thin-provisioned disks. After doing some digging, I found there is a Overcommit ratio metric for datastores, so in this blog I will review the creation of a custom view that we will then use in a report.
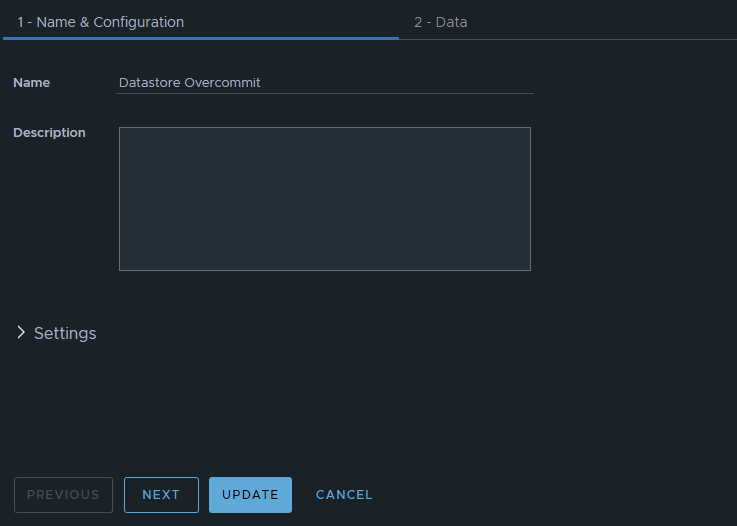
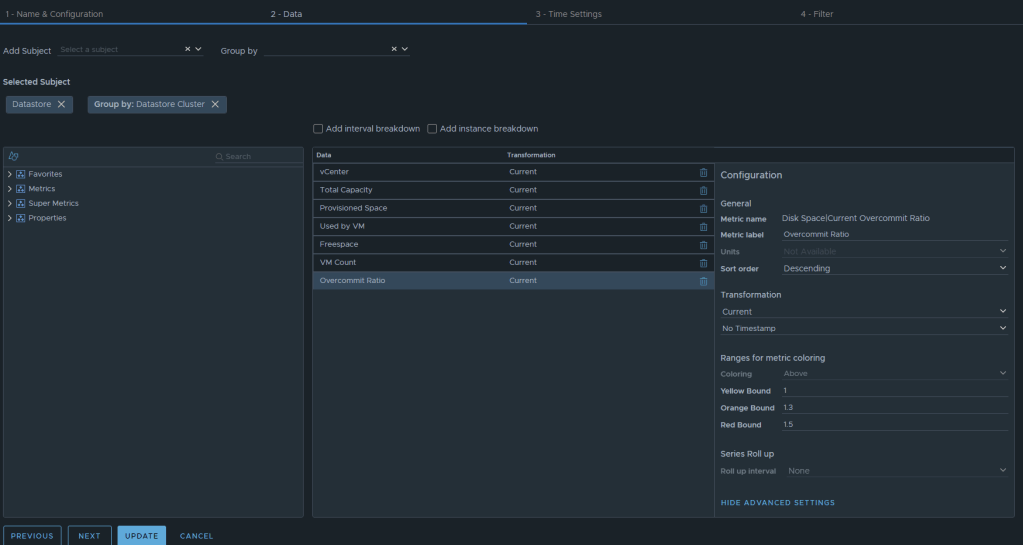
In Aria Operations under Visualize -> Views, create a new view. In this example, we’ll just call it Datastore Overcommit. Click NEXT
Now we can select the metrics desired. We will want to add the subject of “vCenter | datastore”, and then you could also group by “vCenter|Datastore Cluster” if you desire. For this example, I have selected the following datastore metrics: Metric: “Summary|Parent vCenter”. Label: “vCenter” Metric: “Disk Space|Total Capacity (GB)”. Label: “Total Capacity”. Unit: “GB” Metric: “Disk Space|Total Provisioned Disk Space With Overhead (GB)”. Label: “Provisioned Space”. Unit: “GB” Metric: “Disk Space|Virtual Machine used (GB)”. Label: “Used by VM”. Unit: “GB” Metric: “Disk Space|Freespace (GB)”. Label: “Freespace”. Unit: “GB” Metric: “Summary|Total Number of VMs”. Label: “VM Count”. Unit: “GB” Metric: “Disk Space|Current Overcommit Ratio”. Label: “Overcommit Ratio”. Sort Order: “Descending” Coloring Above: Yellow Bound: “1”. Orange Bound: “1.3”. Red Bound: “1.5”
The end result should look something like this:
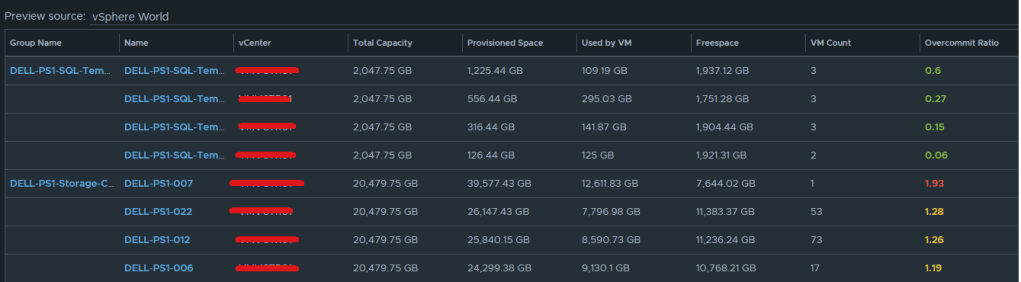
I typically will set the Preview Source as “vSphere World” to see the output data I am getting.
If you don’t like the datastores being grouped by the datastore cluster, then just undo the grouping option, and all of the datastores that are the worst overcommit offenders will rise to the top. The view can now be saved.
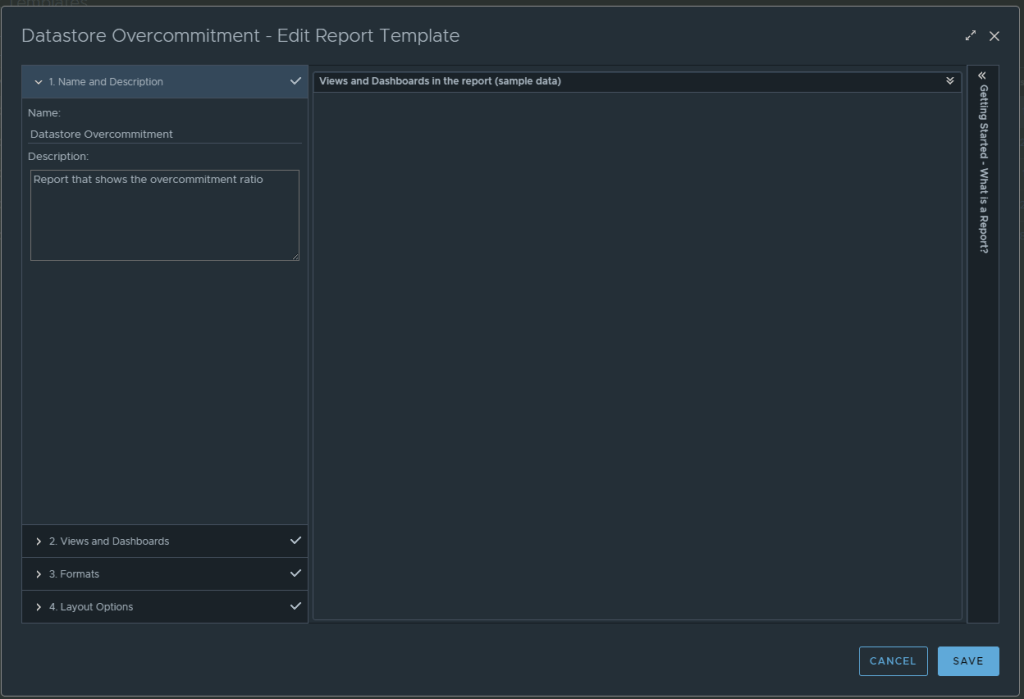
Creating an Aria Operations Report.
In Aria Operations, Under Visualize -> Reports, create a new report. In this example we call it Datastore Overcommitment.
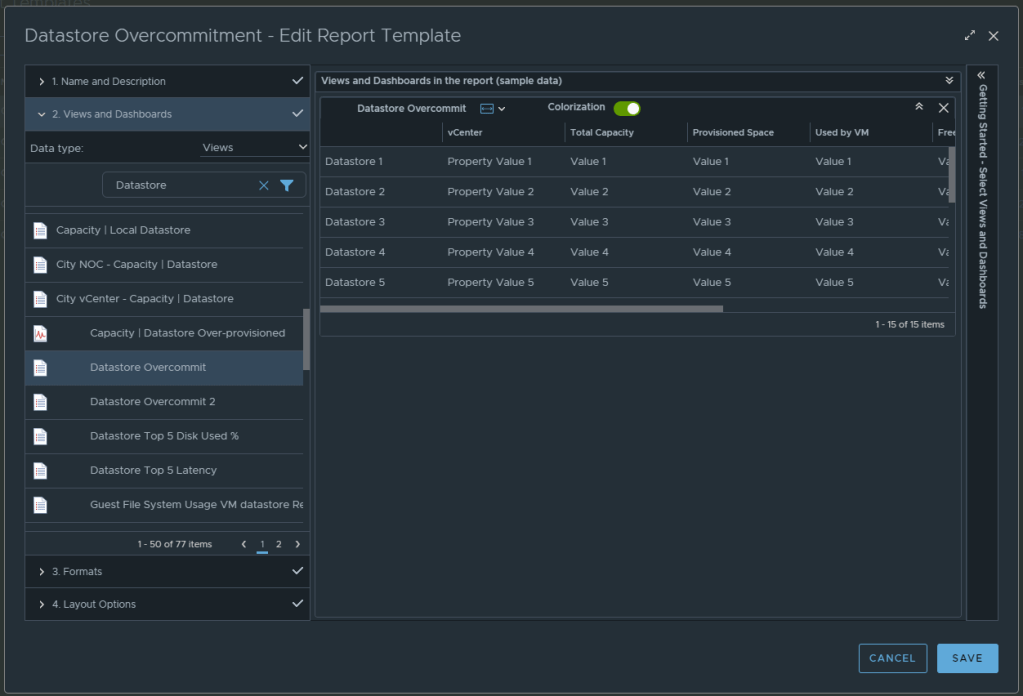
In section 2 for views and dashboards, I searched for datastore and found the newly created “Datastore Overcommit” view created earlier. I dragged it to the right. I changed the Orientation to landscape, and turned on Colorization.
From here, under section 3 you can select the format of the report PDF and/or CSV, and then under section 4 you can elect to add a cover page and what not. I personally like getting a PDF and CSV. Now can click SAVE to save the report.
From here, you can run the report or schedule it. It’s that simple.
For the past couple of months, I have been working with a customer developing Aria Operations (formally vROps) dashboards for various interests. The dashboard I’ll cover here was one I created to help them track and identify the guest file system usage of the virtual machine. This works for both Microsoft and Linux based systems.
Box 1a is a heatmap widget configured as a self provider configured to refresh every 300 seconds. Additional configuration as follows:
The heatmap is a nice visual that will turn red as the guest file system consumes disks on the VM to spot problems. You then select a box in the heatmap to populate the 2a. Box 2a then feeds data into 2b, 2c, 2d, and 2e.
Box 2a is a custom list view widget i created that lists several metrics of the virtual machine with custom metric labels. It is configured to auto select the first row.
Those metrics are: “Badge|Health%“, “Configuration|Hardware|Disk Space“, “Guest File System|Utilization (%)“, (Coloring above: Yellow 75, Orange 80, Red 90); “Virtual Disk:Aggregate of all instances|Read IOPS“, (Coloring above: Yellow 100, Orange 200, Red 300); “Virtual Disk:Aggregate of all instances|Write IOPS“, (Coloring above: Yellow 100, Orange 200, Red 300); “Virtual Disk:Aggregate of all instances|Read Latency (ms)“, (Coloring above: Yellow 10, Orange 20, Red 30); “Virtual Disk:Aggregate of all instances|Write Latency (ms)“, (Coloring above: Yellow 10, Orange 20, Red 30); “Datastore:Aggregate of all instances|Total Latency (ms)“, “Datastore:Aggregate of all instances|Total Throughput“, “Disk Space|Snapshot|Age (Days)“, (Coloring above: Yellow 7, Orange 14, Red 21); “Disk Space|Snapshot Space“.
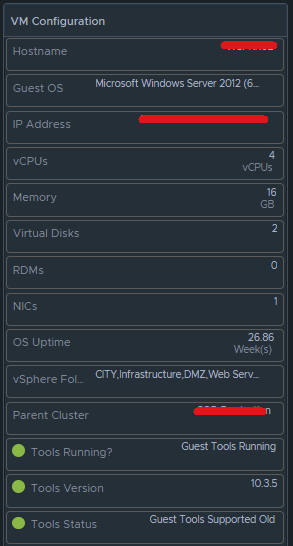
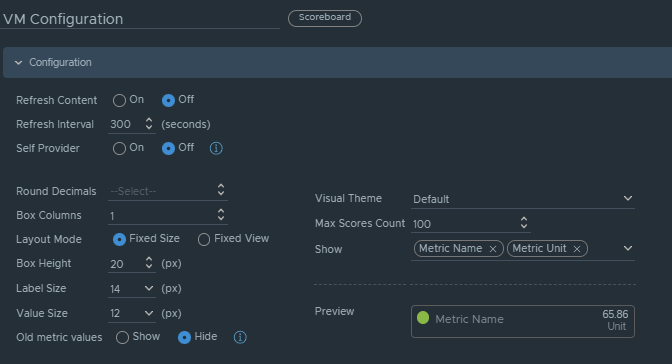
Box 2b is a Scoreboard widget configured to list the selected VM details regarding information on how the VM is configured.
Configuration is set like so:
Under Input Transformation, set to self.
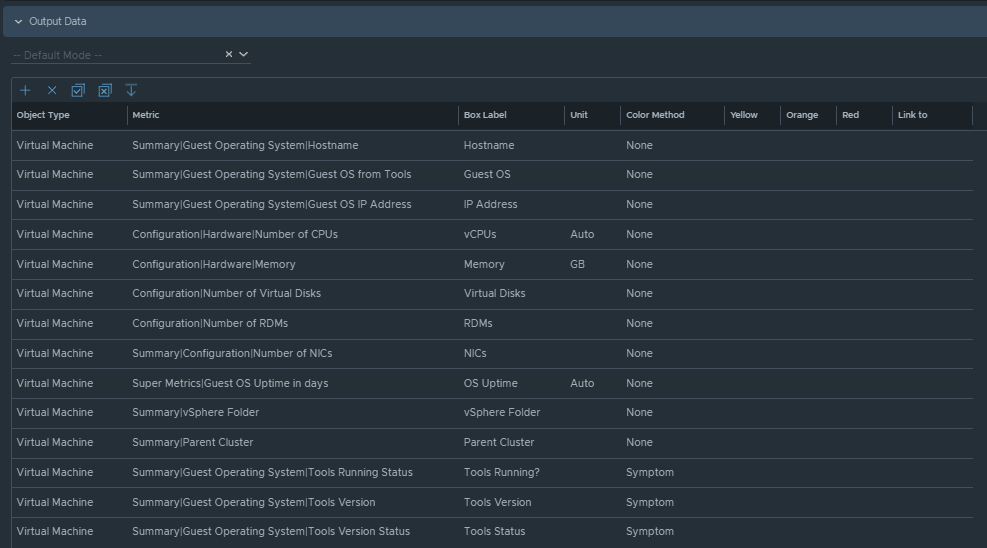
Output Data will be configured as follows:
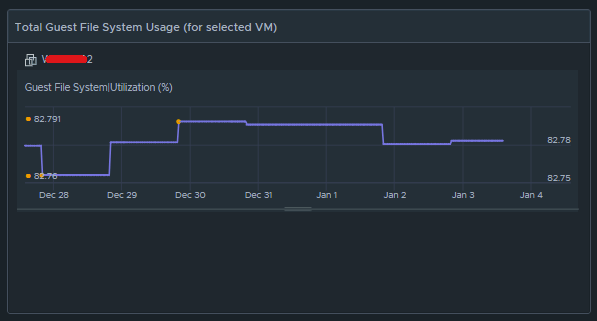
Box 2c is a metric chart widget with the Input Transformation configured as self, and the Output data configured to use the virtual machine metric “Guest File System|Utilization”.
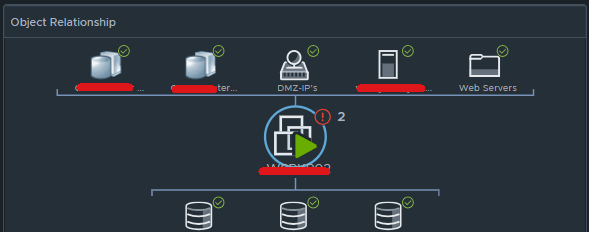
Box 2d is simply the Object Relationship widget.
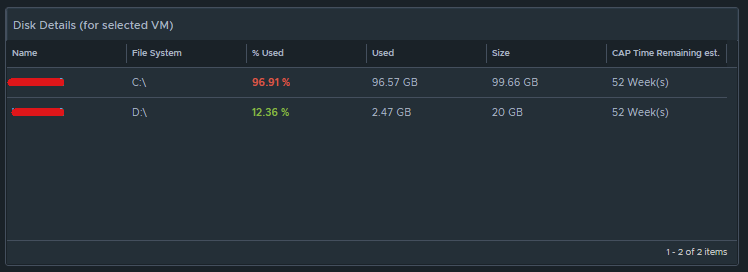
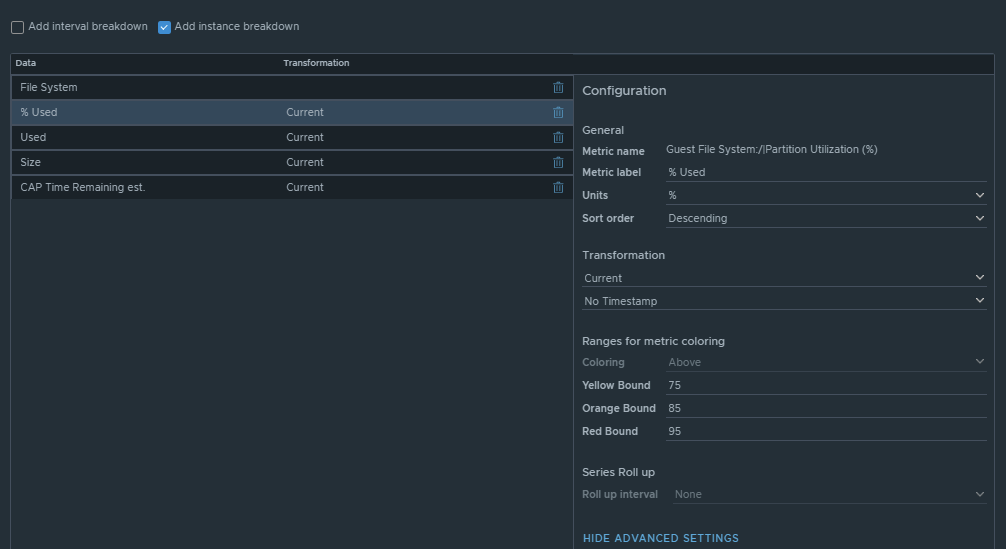
Box 2e is another custom list view and is configured to refresh every 300 seconds.
This list view is configured to do an instance breakdown of the following metrics:
Box 3a is fed data from 2e so that we can see how the virtual machine disks are behaving on the datastore(s).
This is another custom list view configured as follows:
Configuration is set to refresh content at 300 seconds. Output data is configured with a custom list view with the following metrics: “Devices:Aggregate of all instances|Read Latency (ms)“, (Coloring above: Yellow 10, Orange 20, Red 30); “Devices:Aggregate of all instances|Write Latency (ms)“, (Coloring above: Yellow 10, Orange 20, Red 30); “Devices:Aggregate of all instances|Read IOPS“, (Coloring above: Yellow 100, Orange 200, Red 300); “Devices:Aggregate of all instances|Write IOPS“, (Coloring above: Yellow 100, Orange 200, Red 300); “Devices:Aggregate of all instances|Read Throughput“; “Devices:Aggregate of all instances|Write Throughput“.
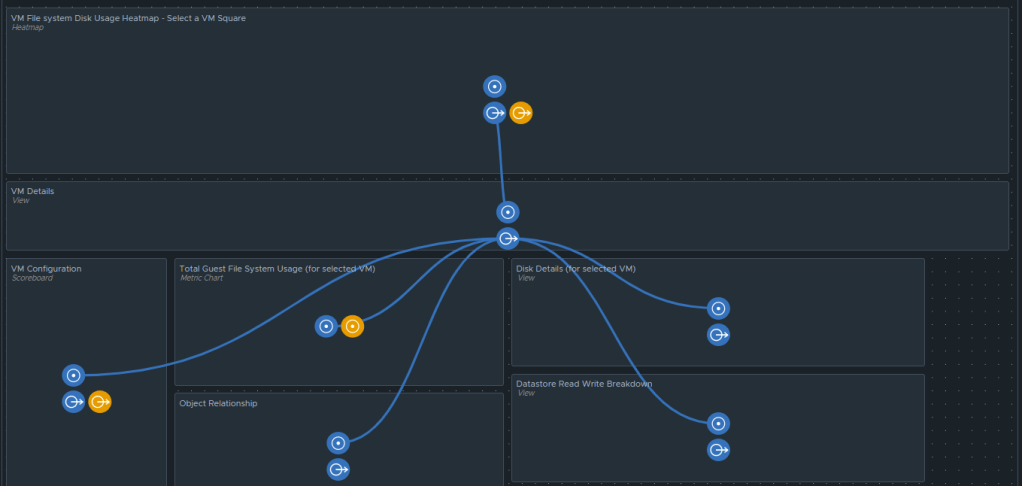
Those are all of the configured widgets on this dashboard. The integration schema will look like this:
I do hope to share this dashboard with the VMware Code sample exchange, and I will update this blog once that has been completed. I hope my breadcrumbs above will enable you to create a similar dashboard in the meantime.
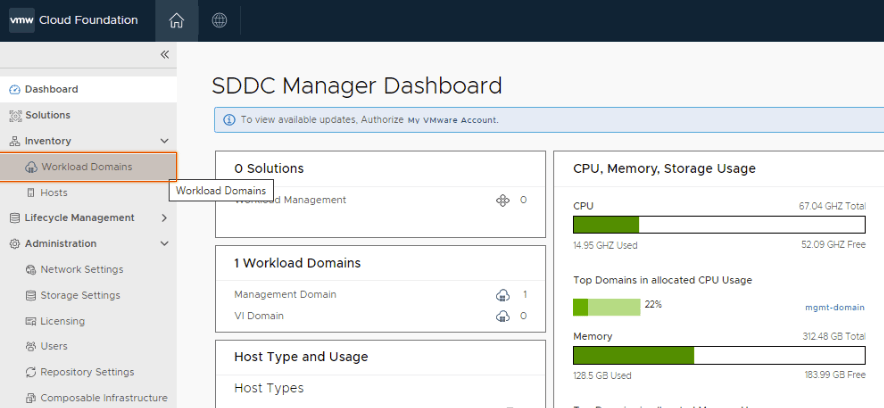
In the previous blog, I went through the process of deploying an NSX edge cluster via VCF in the management domain. In this blog, I will walk through the process of deploying an application virtual network (AVN) for the management domain for the vRealize/Aria suite of products. This deployment assumes that we will be deploying the latter in a VCF aware configuration which would be typical for most deployments. AVNs allow the SDDC Administrator to configure vRealize/Aria management applications for software defined networking through NSX-T Data Center. AVNs configure a local region and a cross-region SDN segment providing security, mobility and flexibility of vRealize/aria management applications. vRealize/aria components can be moved between regions to maintain operations during planned migration, maintenance or in the case of a DR event.
For this, click workload domains.
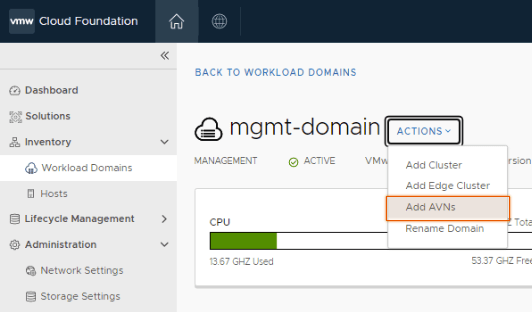
Click on the management domain.
Prior to deploying AVNs, an NSX Edge cluster of two (2) or more nodes is required. In my previous blog, I walked through the SDDC Manager automation that is used to deploy the edge cluster. This post assumes the edge nodes and cluster are in a healthy state, but you can always look via the SDDC manager by clicking on the Edge Clusters tab.
Assuming the edge cluster and nodes are healthy, click Actions and then Add AVNs.
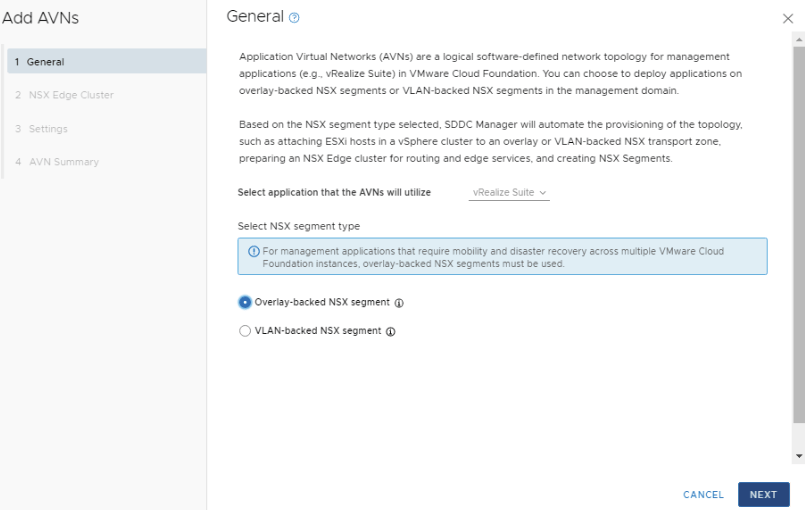
Select Overlay-backed NSX segment and click NEXT.
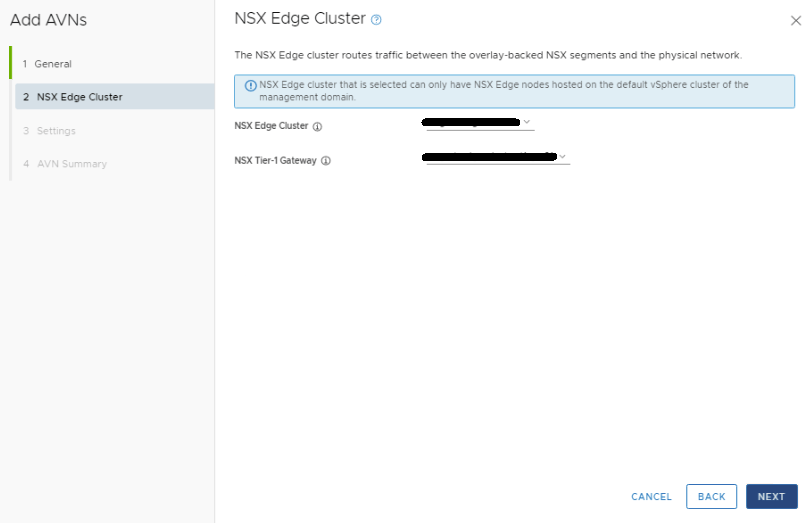
In the NSX Edge Cluster drop menu, select the management edge cluster. In the NSX Tier-1 Gateway drop menu, select the gateway. Click NEXT.
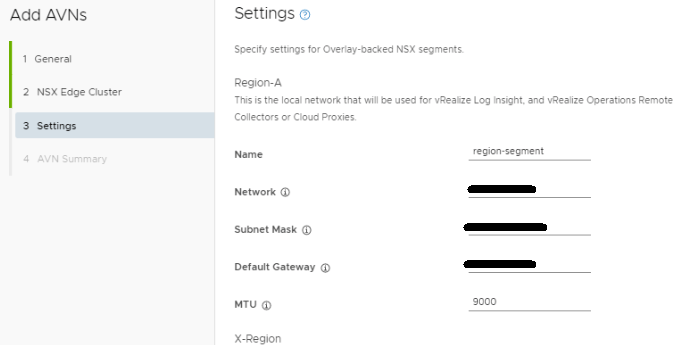
Fill out the network specs for Region-A. An MTU of 9000 was used here to keep the MTU consistent in the environment.
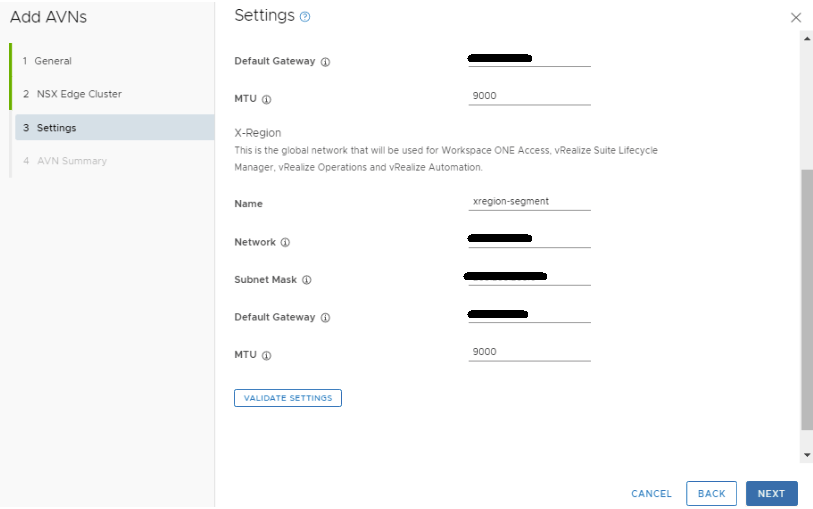
Fill out the network specs for the X-Region section. An MTU of 9000 was used here to keep the MTU consistent in the environment. Click VALIDATE SETTINGS, and then click NEXT after the validation succeeds. Otherwise, remedy the errors and validate the config again.
Review the configurations for accuracy, and click FINISH.
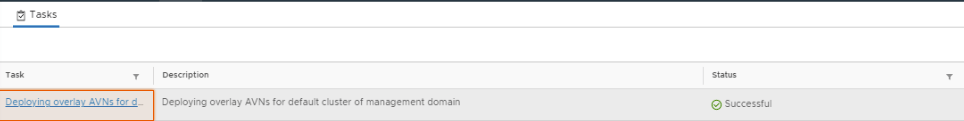
Watch the tasks window in the SDDC manager for deployment task to succeed.
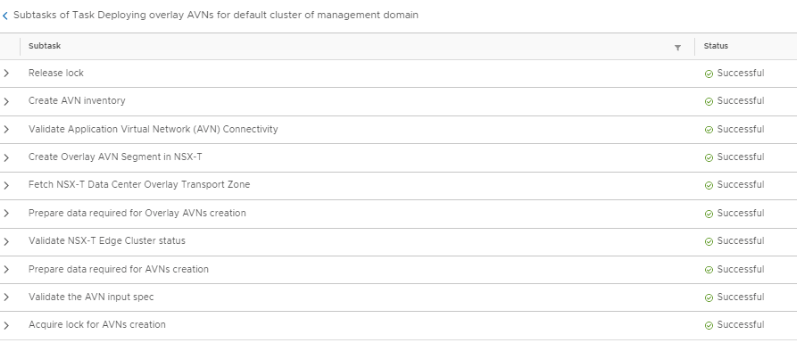
You can also click the main task to see all of the sub tasks and watch for them to successfully complete.
Going back to the summary tab of the management domain, below the NSX-T configuration, you will now see the details of the AVN network just deployed.
Now we have the AVN ready for the vRealize/Aria suite deployment through the SDDC manager.
After VCF has been deployed, and the tier 0 and tier 1 gateways have been configured in NSX, you can log into the SDDC manager and configure the NSX Edge Cluster for the management domain/consolidated domain deployment. A similar process is also used for the NSX Edge Cluster in a workload domain. During the design preparations for the VCF deployment, the NSX cluster would have been defined, along with the network information. Those design considerations and work wont be covered here, and it is assumed you are ready to deploy the edge cluster.
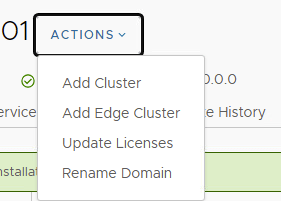
In the left pane of the SDDC Manager, select Workload Domains, and then click the management domain link. In the right pane, click the ACTIONS drop-down menu and click Add Edge Cluster.
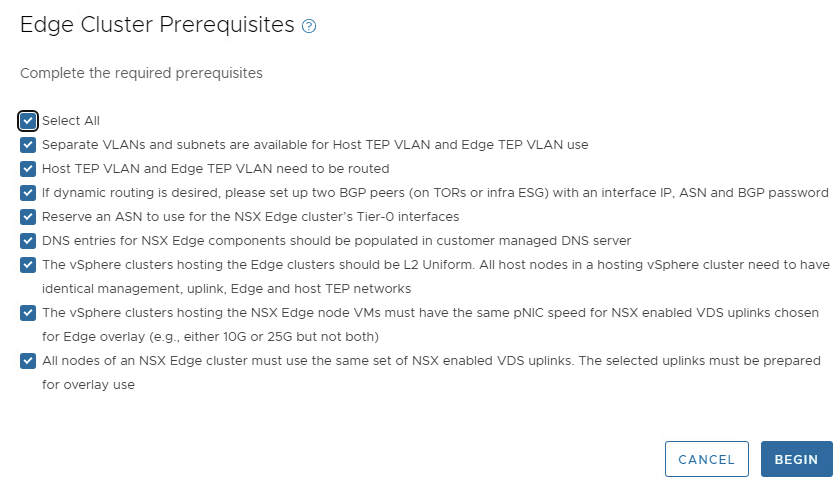
Review the prerequisites, select the Select All check box, and click BEGIN.
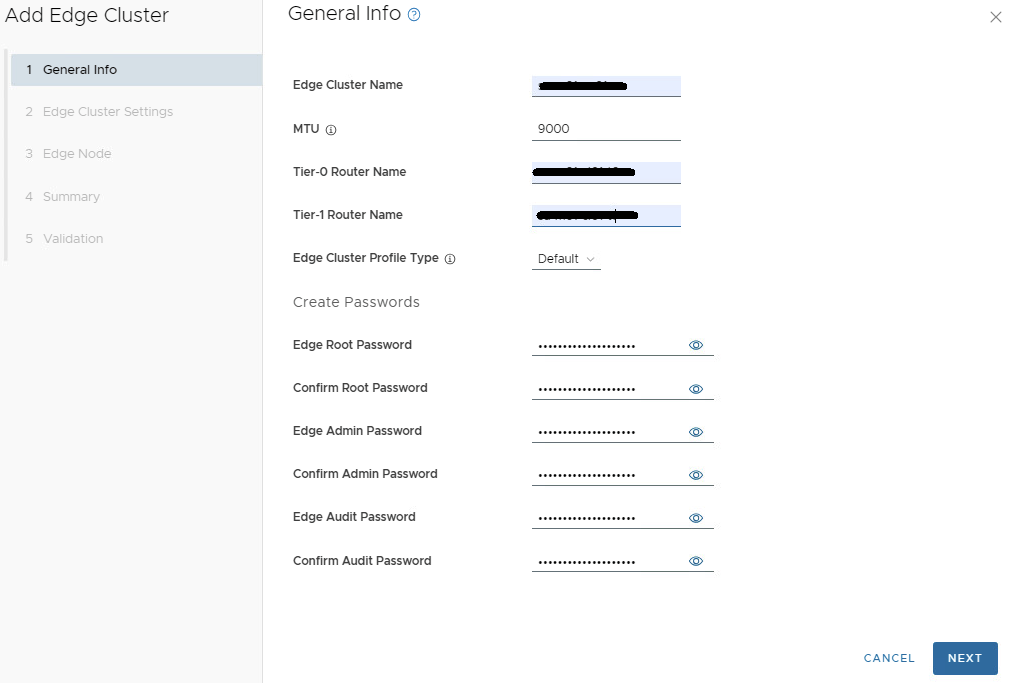
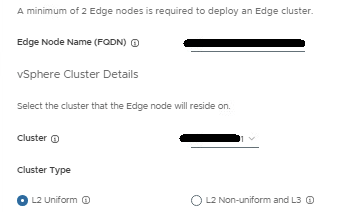
Provide the following information for the new edge cluster. In this example, we are using an MTU of 9000 for simplicity. Edge Cluster Name: MTU: 9000 Tier 0 Name: Tier 1 Name: Edge Cluster Profile Type: Default
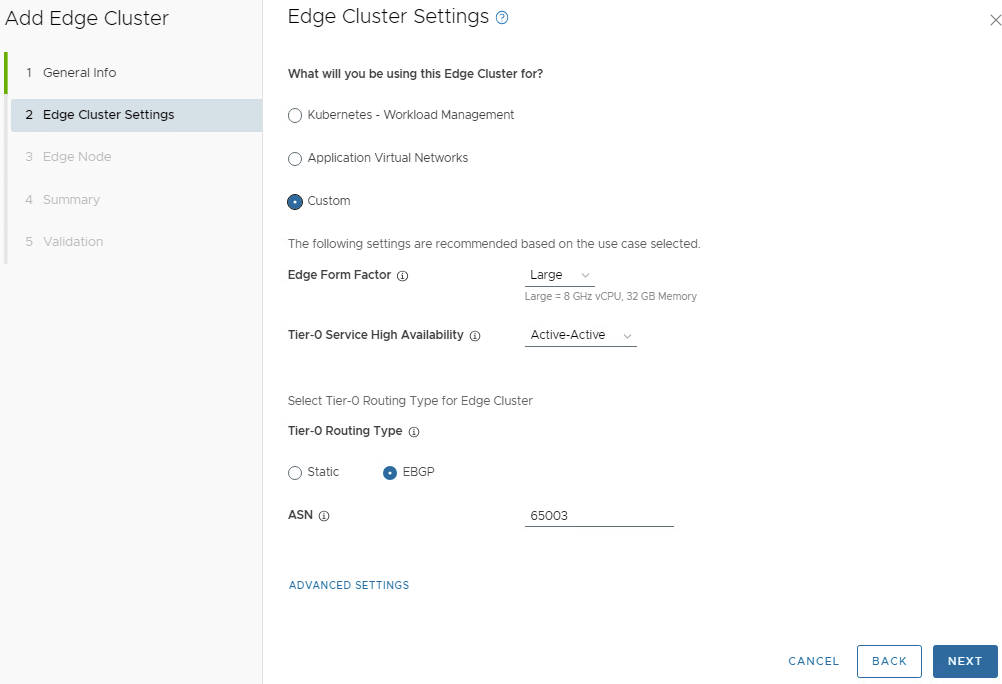
Enter the desired password for the password boxes. Click NEXT. Enter the details for what the edge cluster will be used for. On the Edge Cluster Settings, in this example we will select Custom.
The edge cluster size will be determined during the design phase of the NSX edge cluster. In this example, we have Large selected. Your mileage may vary.
Validate that the Tier0 Service High Availability is Active-Active. Validate that EBGP is selected as the Tier0 Routing Type. Enter the correct ASN number for your environment. Click NEXT.
Provide the cluster details for the first edge node. Cluster type setting will vary depending on your environment configuration:
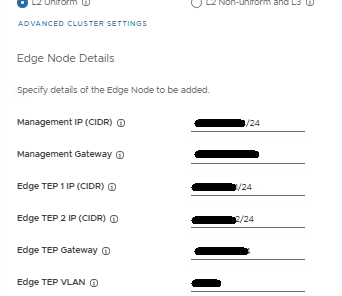
Fill in the Edge Node details for the TEPs.
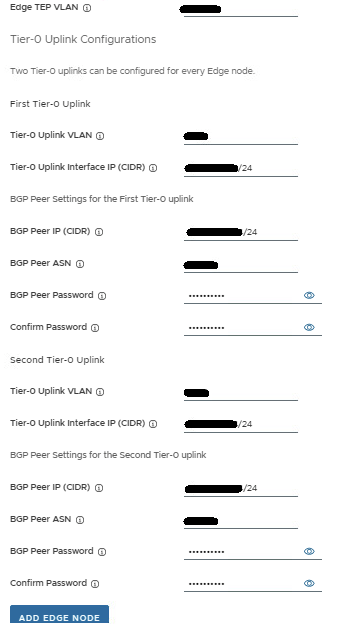
Now add the first Tier-0 uplink and BGP info, and second Tier-0 uplink and BGP info.
Review the values entered to insure accuracy, and then click the ADD EDGE NODE button. The config for the first edge node has been saved.
Now you need to add the config details for the second edge node. Click ADD MORE EDGE NODES which takes you to the top of the Edge Node Details page. You’ll notice the previous values entered are still present. Starting from the top, work your way to the bottom, and carefully update all entries with the second edge node config.
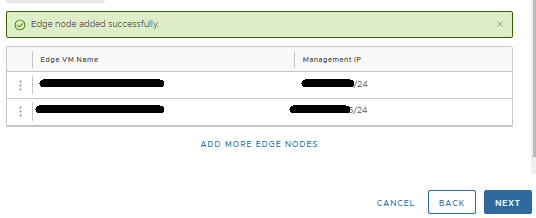
Review the values entered to insure accuracy for the second edge node, and then click the ADD EDGE NODE button. The config has been saved.
At this point, two edge nodes should be shown. More can be added if needed, but two nodes offer sufficient redundancy. Click NEXT.
Review the summary and ensure that you entered the values correctly.
IMPORTANT:
Ensure that you entered the IP addresses, FQDNs, and VLANs correctly by comparing all values with the network diagram. Any data entry error will cause errors in deployment.
Click NEXT
Wait for validation to complete.
If any checks fail, record the cause, and verify that no values are incorrectly entered in the wizard. CAUTION: Do not click FINISH unless the validation succeeds for all checks. If the validation checks succeed, click FINISH.
You can monitor the deployment in the SDDC manager tasks pane in the bottom of the screen. If you click on the task name for adding the edge cluster, the sub-deployment tasks will be shown.
Wait for the edge cluster deployment task to complete before deploying application virtual networks.


You must be logged in to post a comment.